Authored by Sven Henrich via NorthmanTrader.com,
I’ve been saying it for a while: The extremes are becoming ever more extreme, to the upside as well as to the downside. Last year I kept highlighting multiple warning signs in markets leading into the 35% crash ( example: Never go full retard) and now I feel like I’m repeating the same exercise again. People forget tops are processes and bottoms are events and as processes take time to unfold, but when things crack they tend to move quickly.

Indeed markets seemingly keep repeating the same cycle:
I see we’re playing this game again. pic.twitter.com/6h5il7TATw
— Sven Henrich (@NorthmanTrader) January 12, 2021
While the crash is now long forgotten it was nevertheless real and while I never call for crashes I certainly will want to continue highlight risk issues I see, especially now we are staring at the largest valuations and technical disconnects ever.
In fact we are seeing stocks and some indices behaving in ways we haven’t seen since the year 2000 tech bubble. There simply is no history in how smalls caps are behaving at the moment for example:
Small caps: The undiscovered country.$IWM pic.twitter.com/Qw731gWbFR
— Sven Henrich (@NorthmanTrader) January 12, 2021
Vertical price moves have consequences. And as stretched as small caps and the rest of the market was during the peak of the crash in March of 2020 (hence the bullish call at the lows) as stretched charts are now to the upside.
Indeed the technical stretches are so vast they themselves are screaming danger as the charts are practically begging for rebalancing and reconnects.
Just to highlight a select few charts using the 5 EMA, the exponential moving average on longer term time frames, consider:
$NDX quarterly:
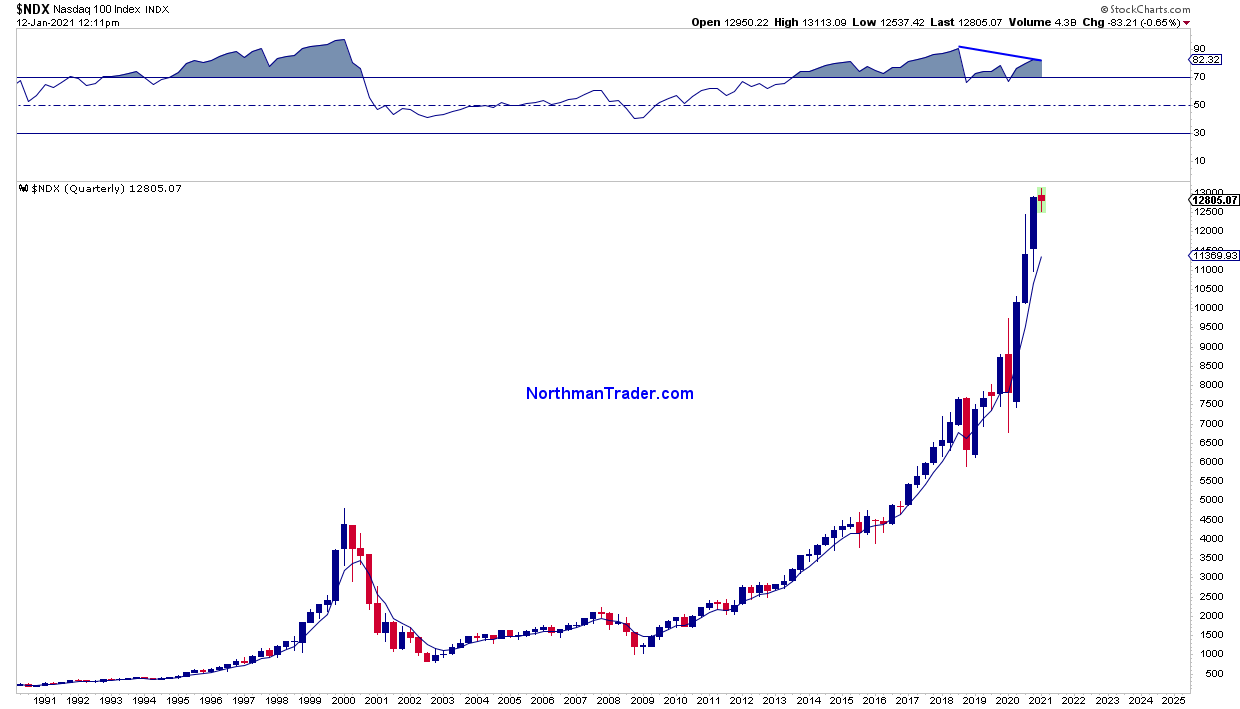
While 5 EMA disconnects can persist they always happen and times of extreme reconnect tend to make reconnects more violent. See 2000, see 2018 and even in early 2020.
Now $NDX has begun this quarter with a near 15% disconnect from the 5 EMA as $NDX surpassed the 13,000 level.
The message is even more dramatic on the yearly chart:
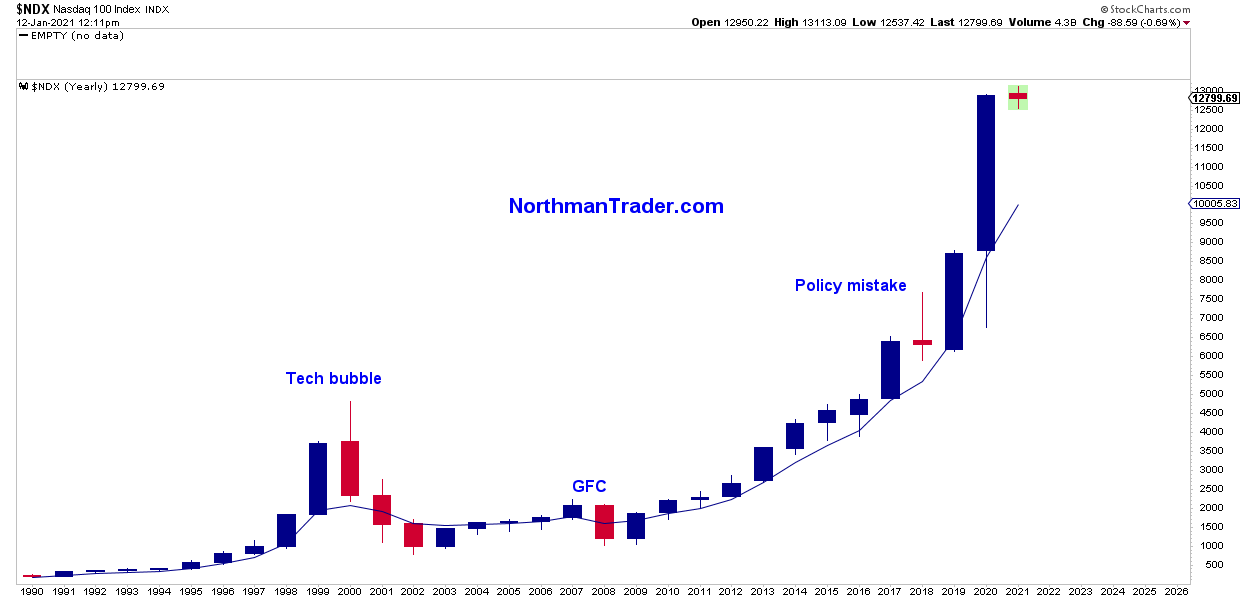
Don’t @ me because I’m using linear charts here, versus log charts, it makes no difference in the math or the size of the disconnect.
With $NDX at 13,000 that’s a near 30% disconnect from the yearly 5 EMA. That’s a lot of runaway optimism to want to sustain or to want to bet on sustained further upside.
$IWM quarterly, same message of course:

And here’s $SPX on a yearly basis:
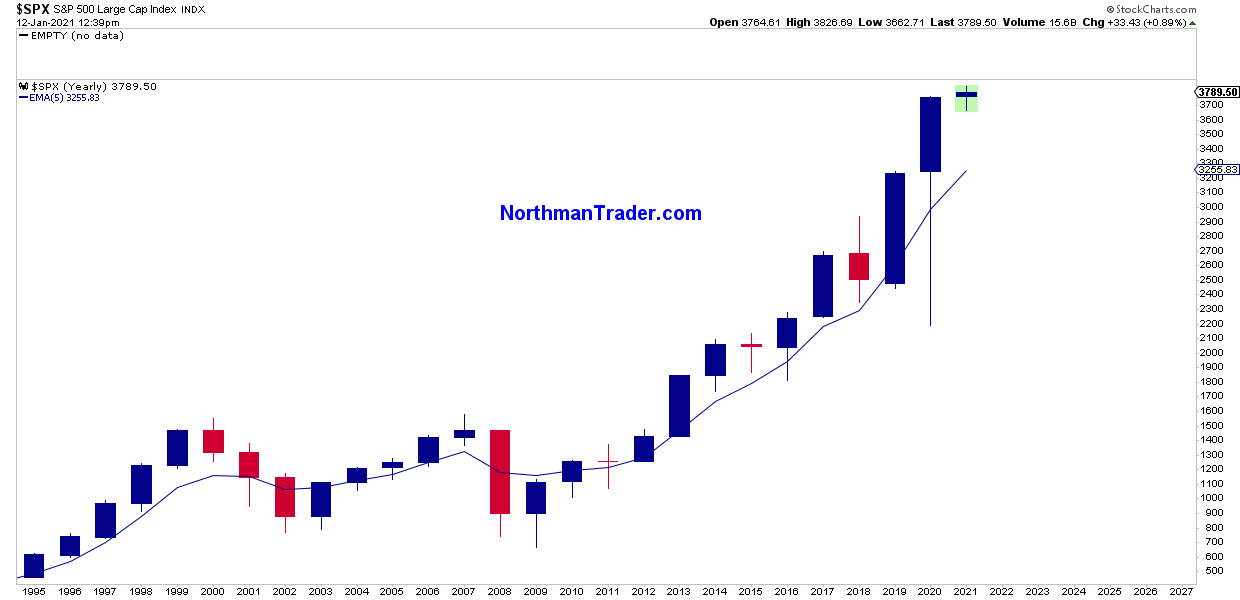
I can’t predict the when and where, but yearly 5 EMA reconnects or at least approaches toward them are common market history, that’s just a fact and hence suggestive that this market has technical reversion risk in its future.
Ironically the $SPX yearly 5 EMA sits right at 3255 at the moment. Why ironic? Because tagging it would imply filling all the open gaps from November:
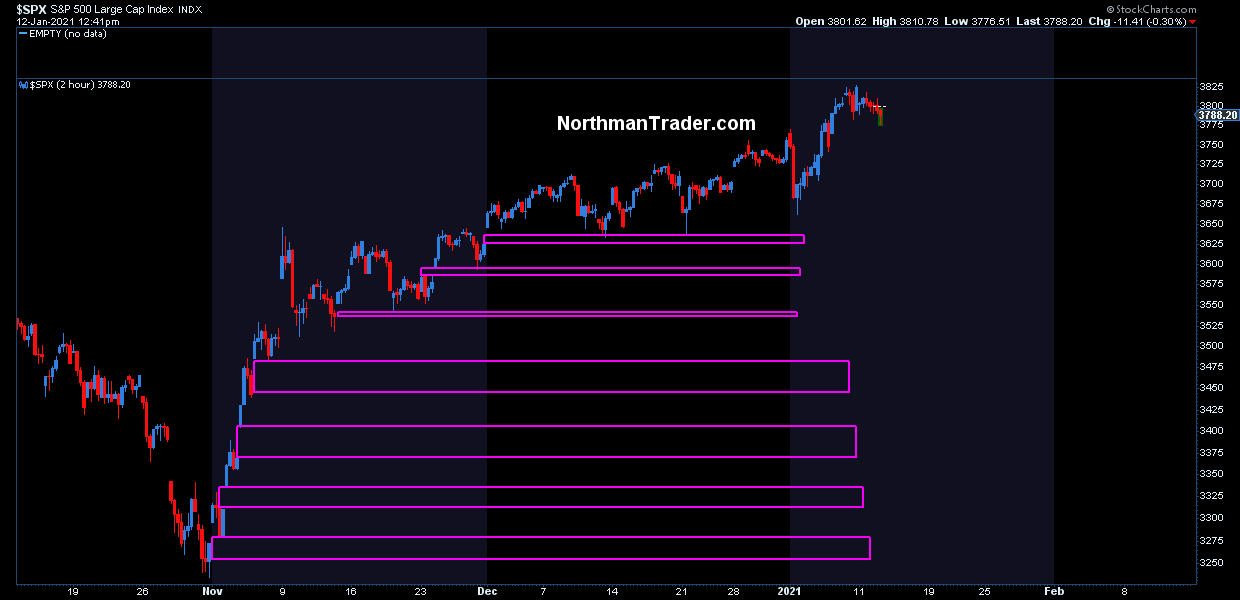
Now at this stage it would likely take a trigger event to bring about such a move, be it the yield curve or the dollar (see also Freak Show, The Alternative View, or something else) but a reconnect would check technical tick boxes and fill a bunch of open gaps and satisfy a lot of technical misgivings about the current market stretch. Time will tell. But the risk of technical reconnects, be it on the quarterly or yearly charts, is very real as it was last year (see $NDX check). And when and if reconnects happen they may present tradable long entry opportunities. But we’ll cross that path when we get to it.
* * *
For the latest public analysis please visit NorthmanTrader. To subscribe to our market products please visit Services.