
Americans’ Real Wages Are Shrinking As CPI Tops 4% For First Time In 3 Years
With expectations of a 4%-plus print, all eyes are on this morning’s CPI report as we move past April’s shutdown-related distortions.
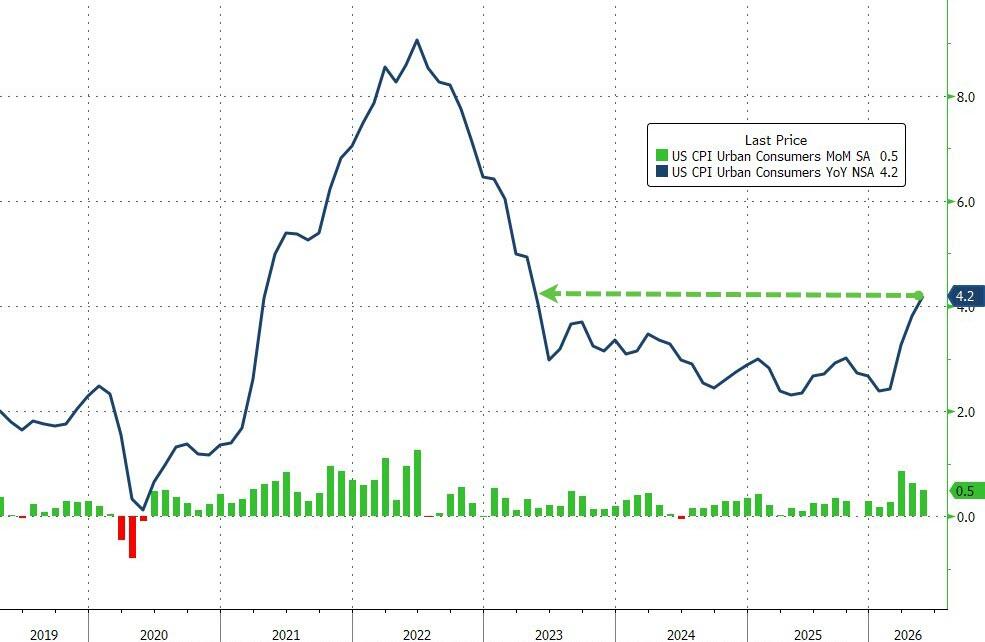
Headline CPI rose 0.5% MoM (as expected) in May, lifting prices 4.2% YoY (also as expected). The first 4%-plus print since April 2023…
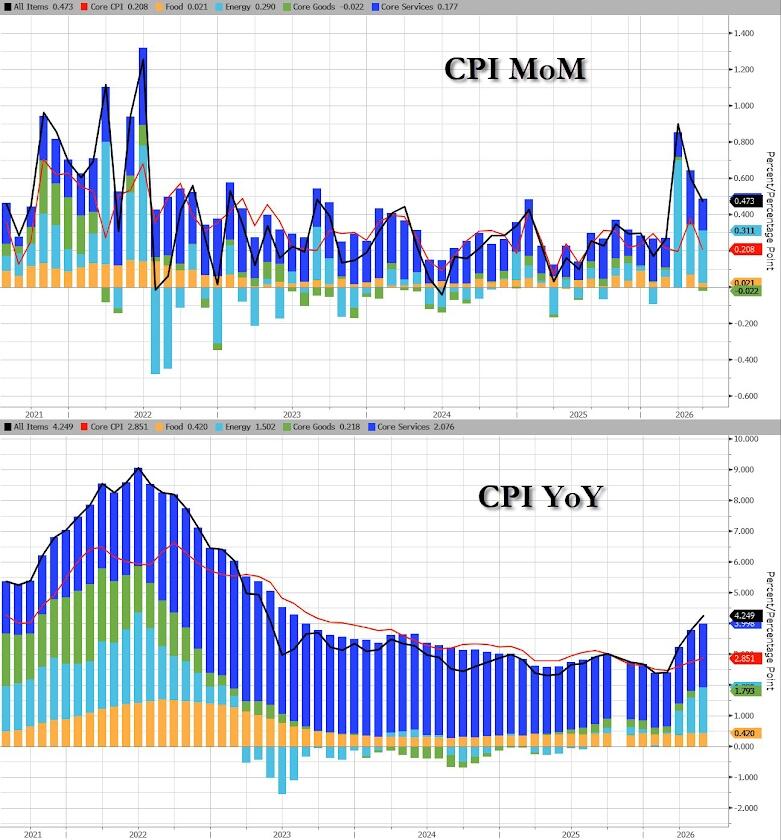
Core Goods prices deflated in May while Energy remains a notable contributor…
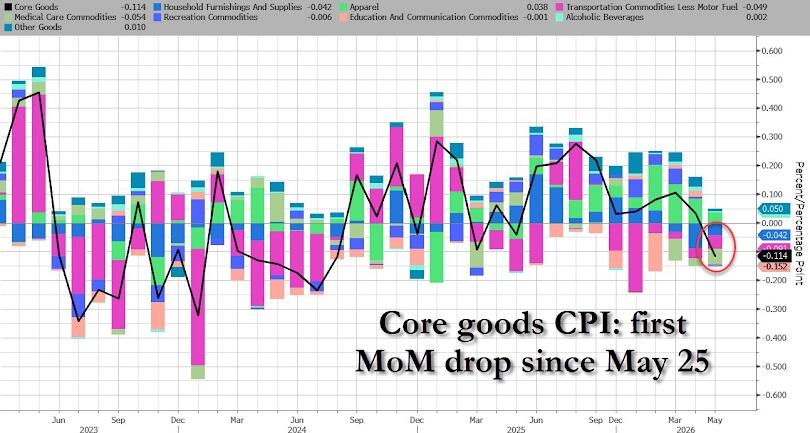
This is the first deflationary print for goods prices in a year…
-
Household furnishings and Supplies -0.042%
-
Transportation Commodities less motor oil: -0.49%
-
Medical Care Commodities -0.54%
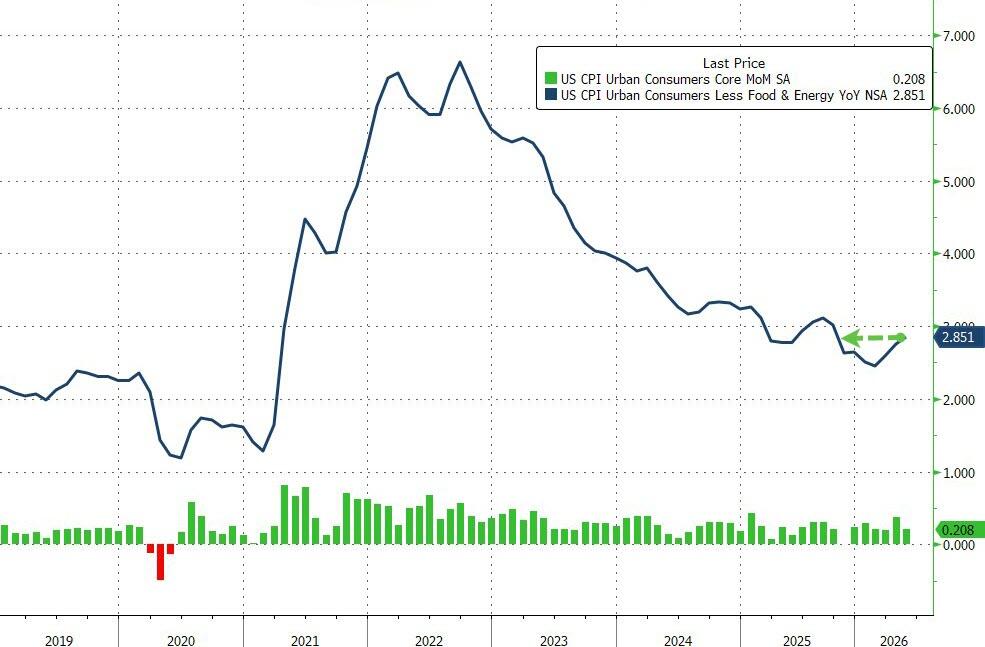
Core CPI rose less than expected (+0.2% MoM vs +0.3% MoM exp), lifting prices by 2.9% YoY (as expected), up from April’s 2.8% YoY and the highest since Sept 2025…
Core Services costs are accelerating…
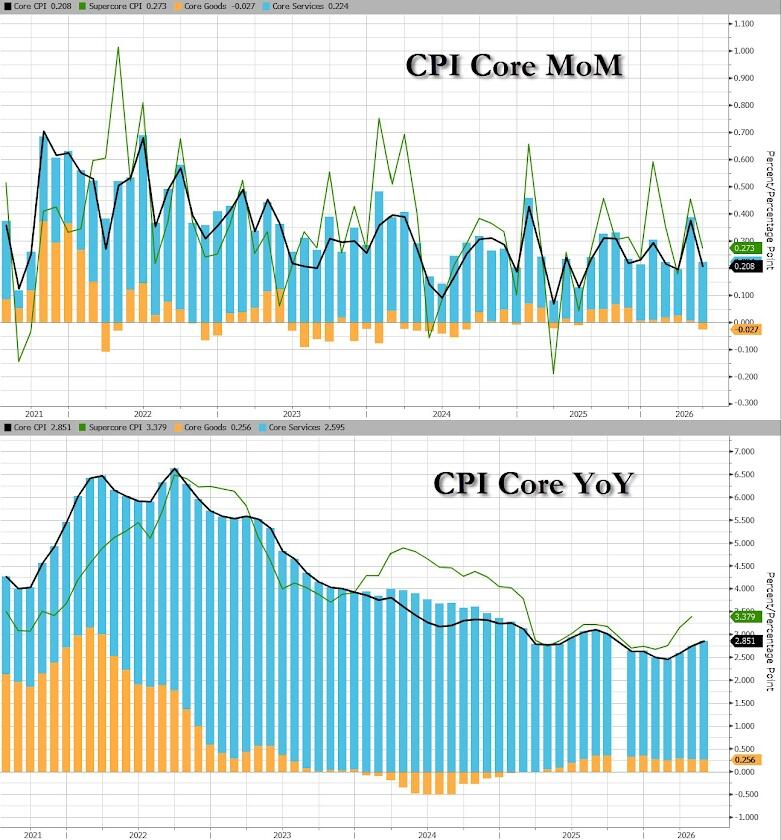
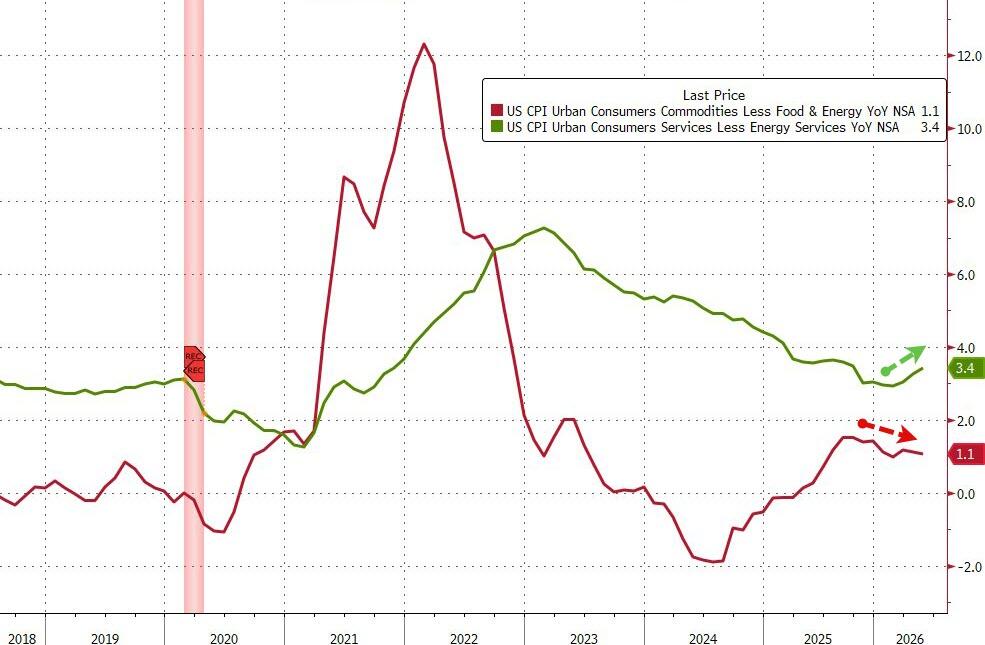
Goods inflation overall is trending lower while Services costs are accelerating…
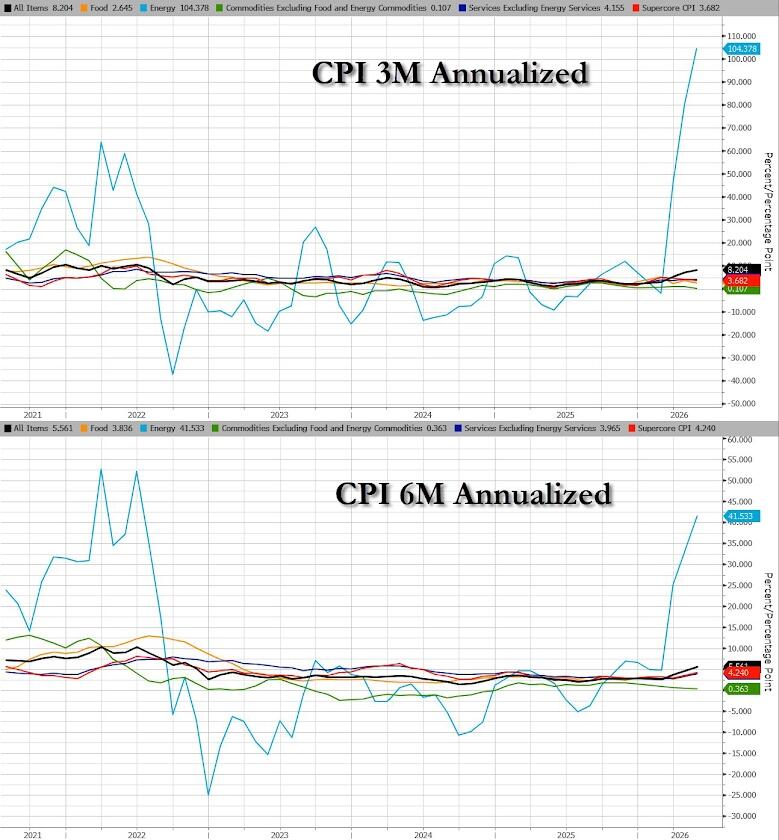
On a shorter-term basis, its all about energy…
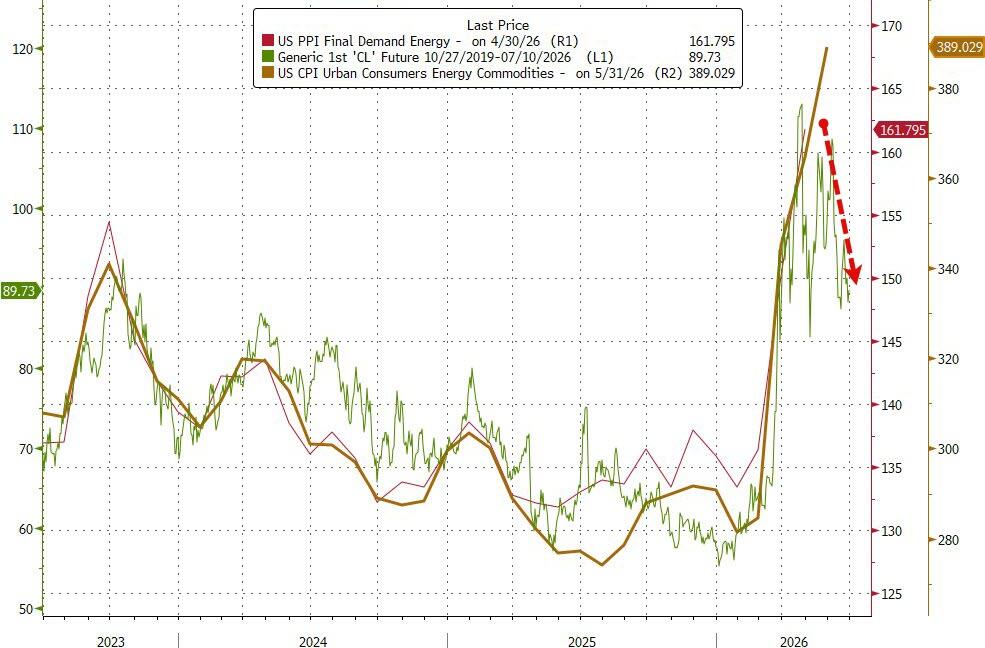
But, is this the peak of Energy-cost-driven inflation?
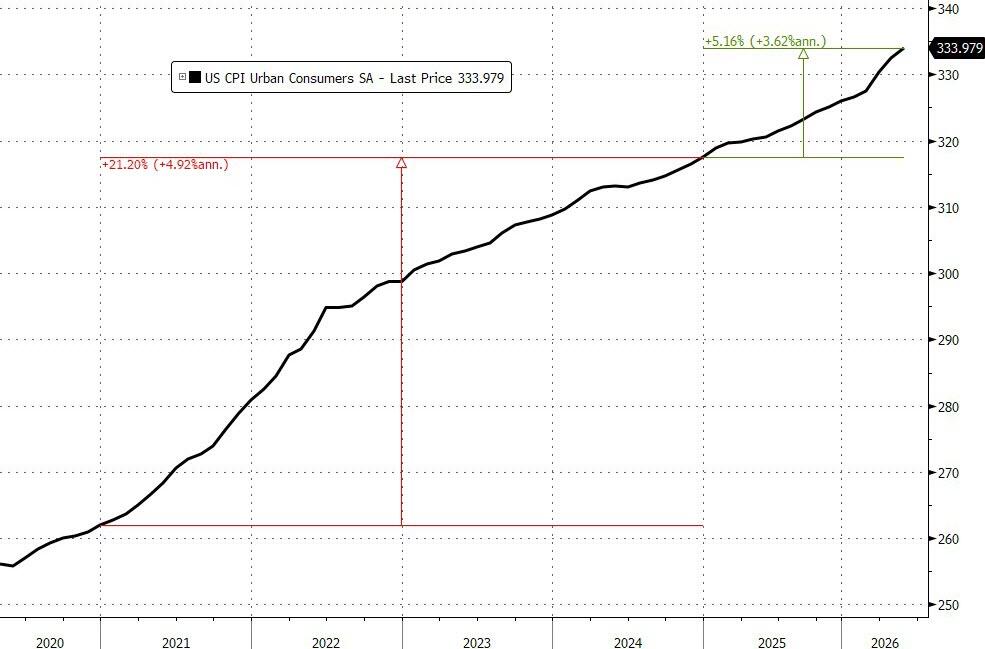
This leaves headline consumer prices up 5.16% since President Trump came to office…
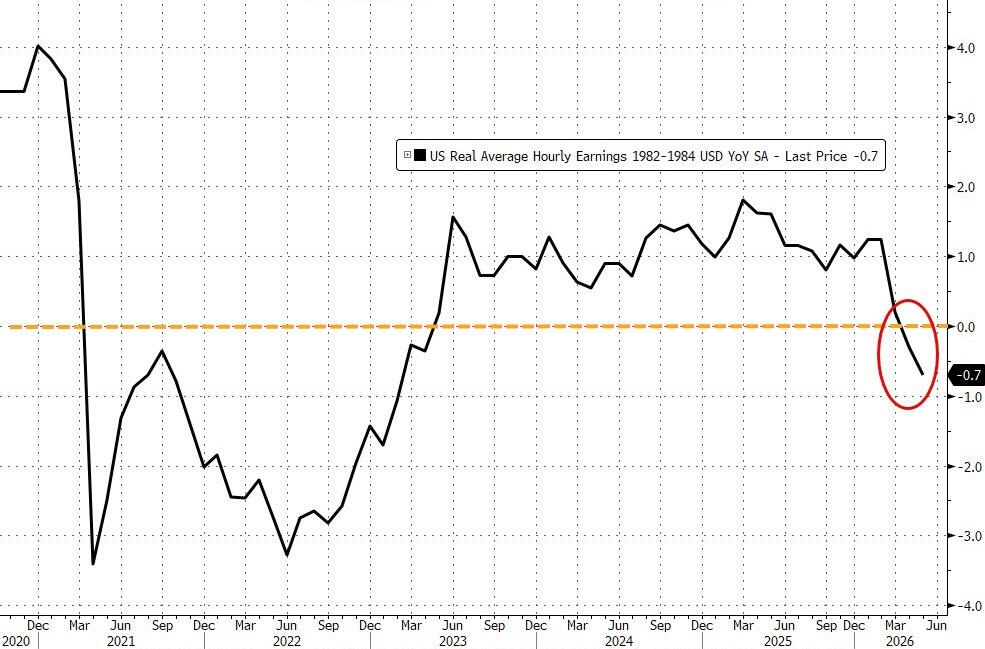
And perhaps most notably, Americans’ real wages are shrinking on a YoY basis (for the first time since April 2023)…
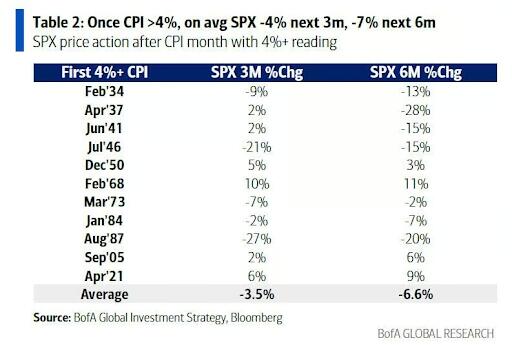
BofA’s Michael Hartnett previously warned that a May print above 0.4% (estimates currently have it a 0.6%) means US CPI >4% YoY and on course for 5% by US midterms, and risk assets get twitchy: in the past 100 years once CPI crosses 4% on average, the S&P is down 4% in the next 3 months, and down 7% next 6 month…
Finally, while nattering nabobs of mainstream media will be decrying Trump’s terrible record on prices, Deutsche Bank’s Jim Reid notes that when looked at over the full century, inflation above 4% is not especially rare: over a quarter of monthly observations have exceeded this level.
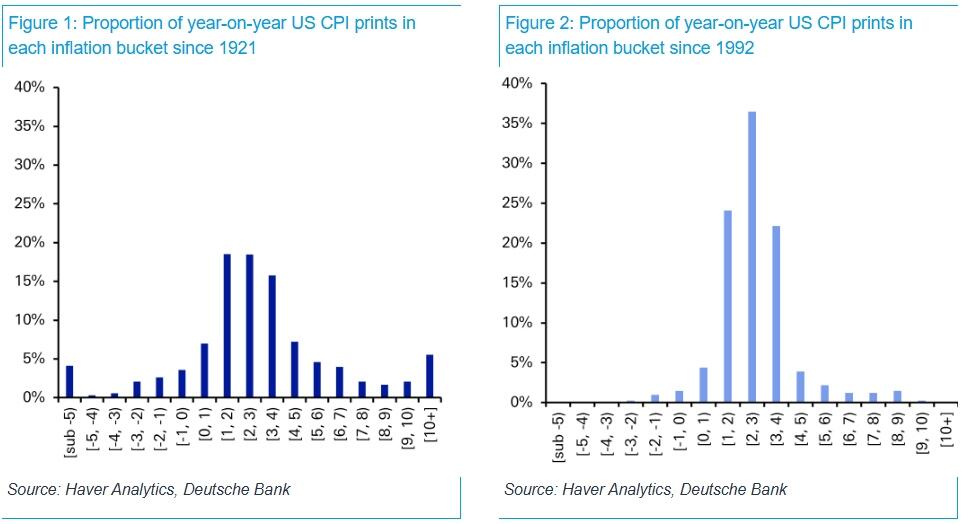
However, these episodes have tended to arrive in distinct waves – most notably around WWII, during the 1970s, and more briefly in the post-Covid period.
Smaller but still meaningful pockets also appeared during the late-1980s boom and ahead of the GFC.
The more recent experience looks very different.
Since 1992, 83% of observations have sat comfortably in the 1–4% range, with just 10% printing above 4%. For most market participants, then, inflation above 4% has been an exception rather than the rule.
The key question is whether the future looks more like the last 35 years or the full 105-year monthly history.
While there are no immediate signs of inflation running away, the disinflationary environment of the past few decades benefited from a set of unusually supportive, and largely non-repeatable, global forces.
So going forward the template from the last century rather than the last few decades will probably be the better guide.
Tyler Durden
Wed, 06/10/2026 – 08:39