
Core PCE Prints Cooler Than Expected Due To Change In Methodology, As Savings Rate Plunges To 3 Year Low
Ahead of today’s closely watched core PCE report – the Fed’s (reportedly) favorite inflation indicator (although that will probably shift to Truflation after Kevin Warsh’s task force is done with analyzing the data), which was seen by many as deciding whether the Fed will hike in October and December, or just December as NY Fed president John Williams strongly hinted yesterday, we warned readers that PCE may surprise to the downside: “the Bureau of Economic Analysis updated methodology for calculating inflation in three components is expected to trim August year-on-year change by a few tenths of a percentage point.”
Why PCE may surprise to the downside: the Bureau of Economic Analysis updated methodology for calculating inflation in three components is expected to trim August year-on-year change by a few tenths of a percentage point.
— zerohedge (@zerohedge) September 30, 2026
And surprise it did, because despite rampant energy inflation and record diesel prices, headline PCE came in line sequentially, printing up 0.3%, in line with expectations but coming in far cooler than expected on an annual basis, rising just 3.4%, vs expectations of a 3.7% print.
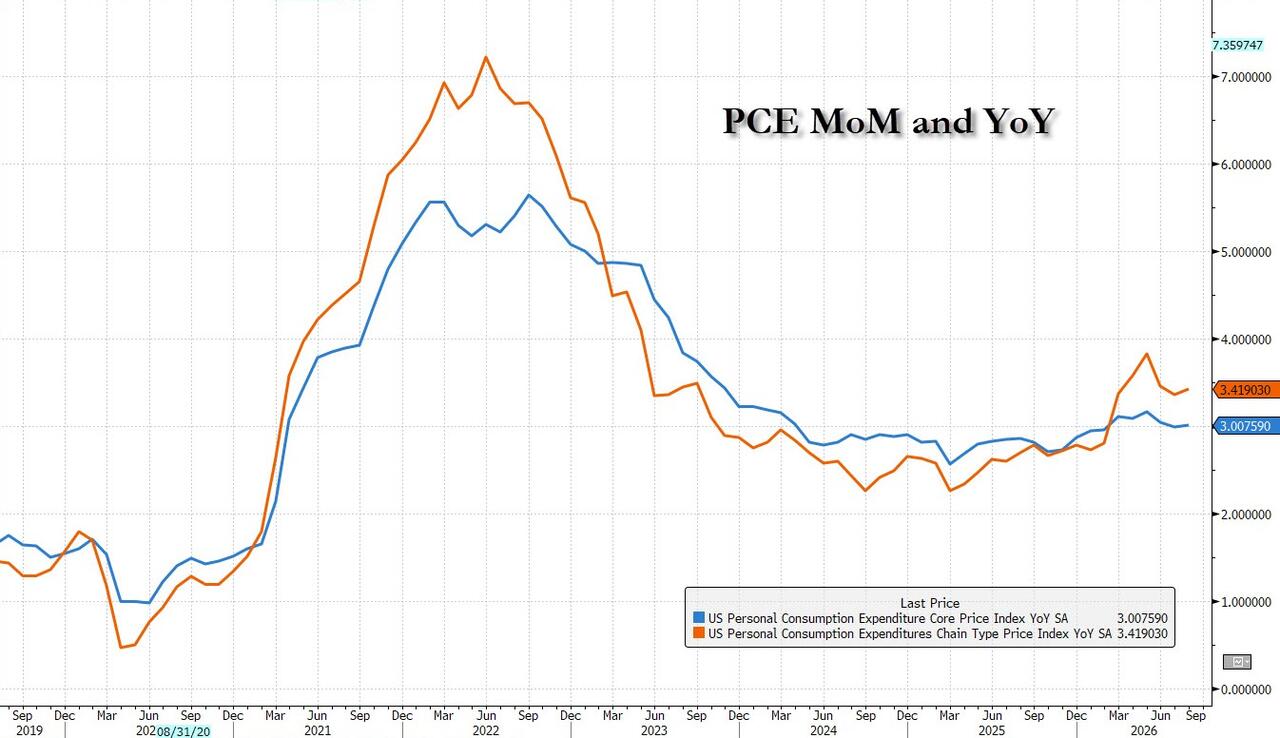
The MoM jump in headline PCE was driven by services, a reversal from last month’s drop, largely due to the spike in communication and education services.
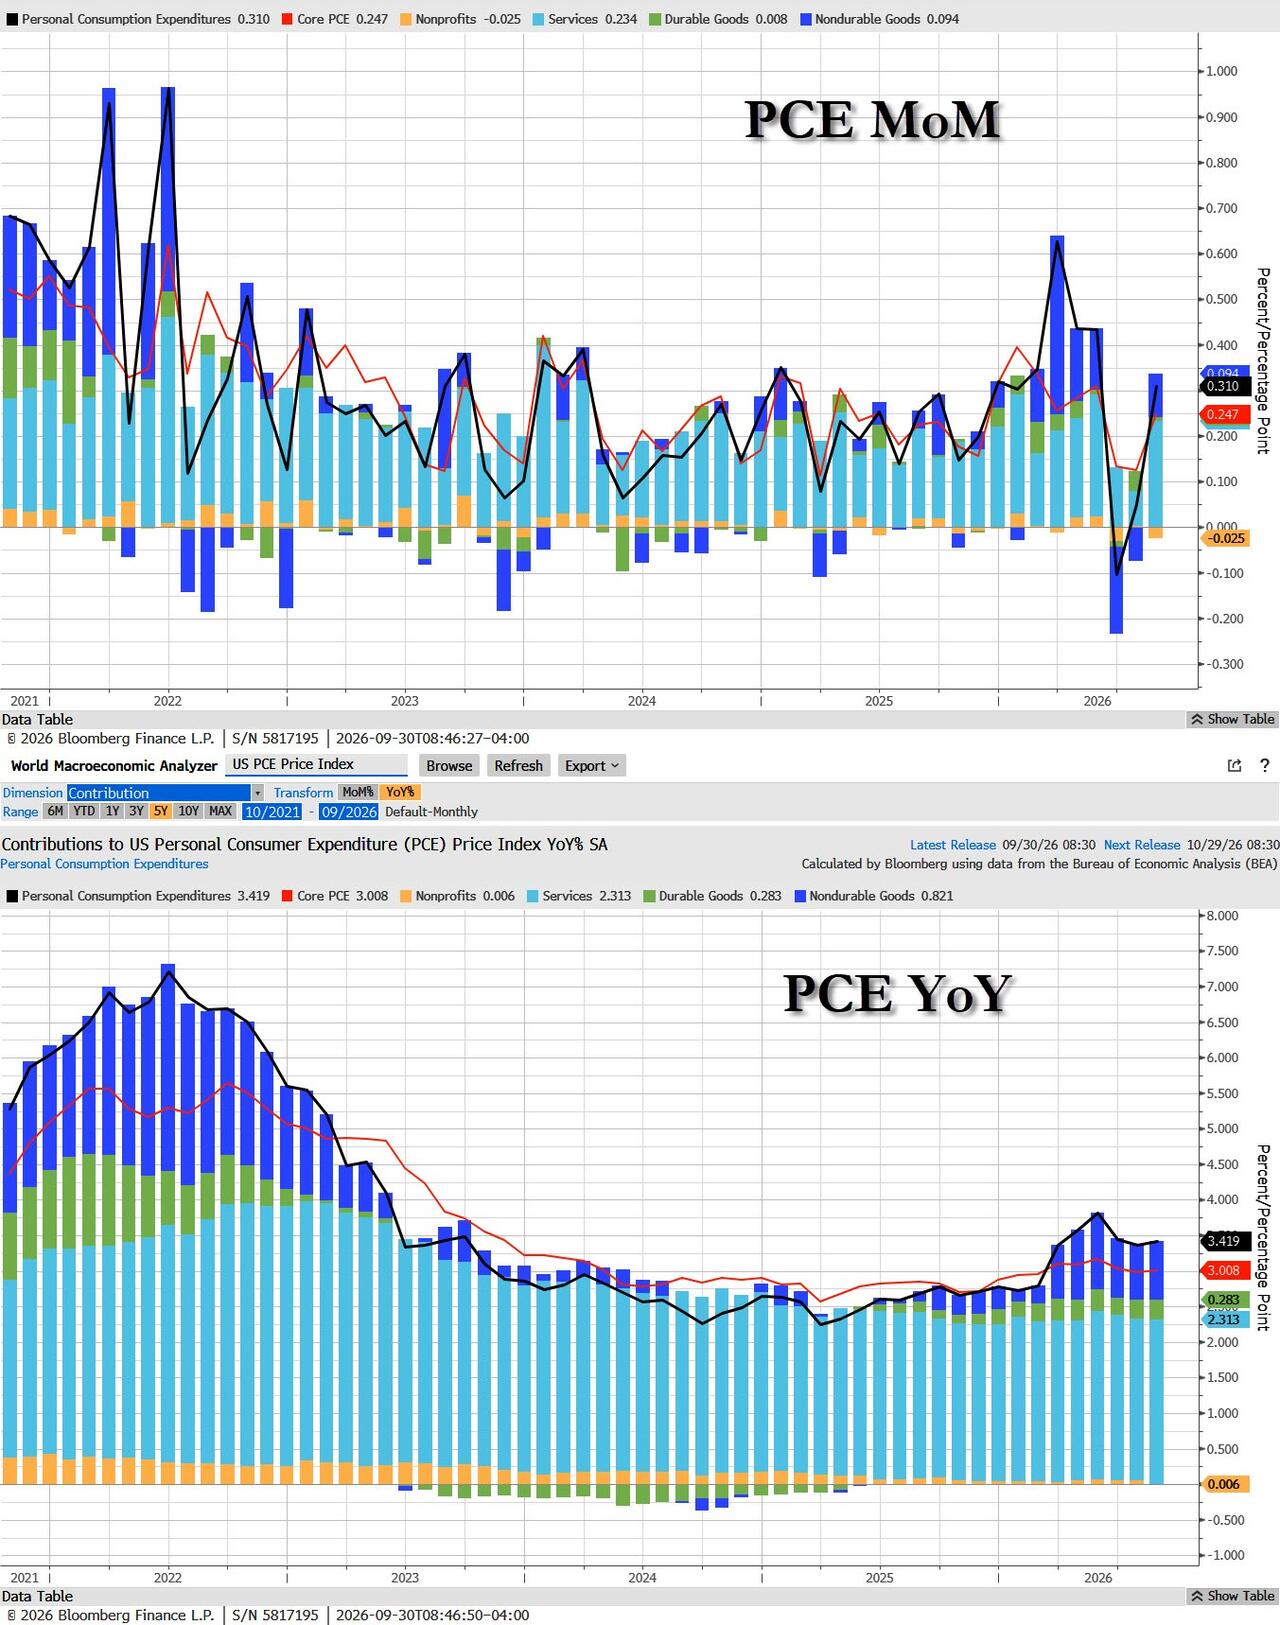
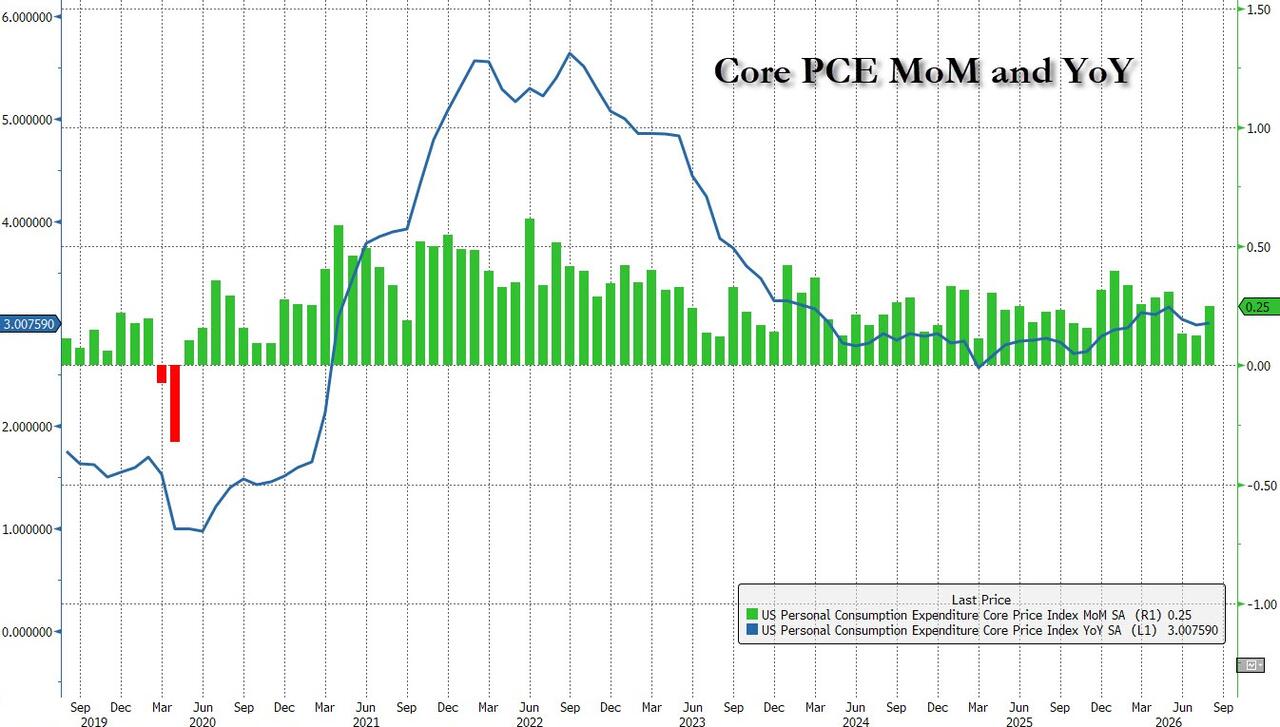
But it was the far more important core PCE, which strips out volatile energy and food prices, that rose 0.2% MoM (technically 0.247%, below the +0.3% MoM expected) with a notable miss in the YoY print, which dropped to +3.0% from the unrevised 3.3% (now revised to 3.0%), missing estimates of a 3.3% print.
Within core, the biggest jump was again communications and education services.
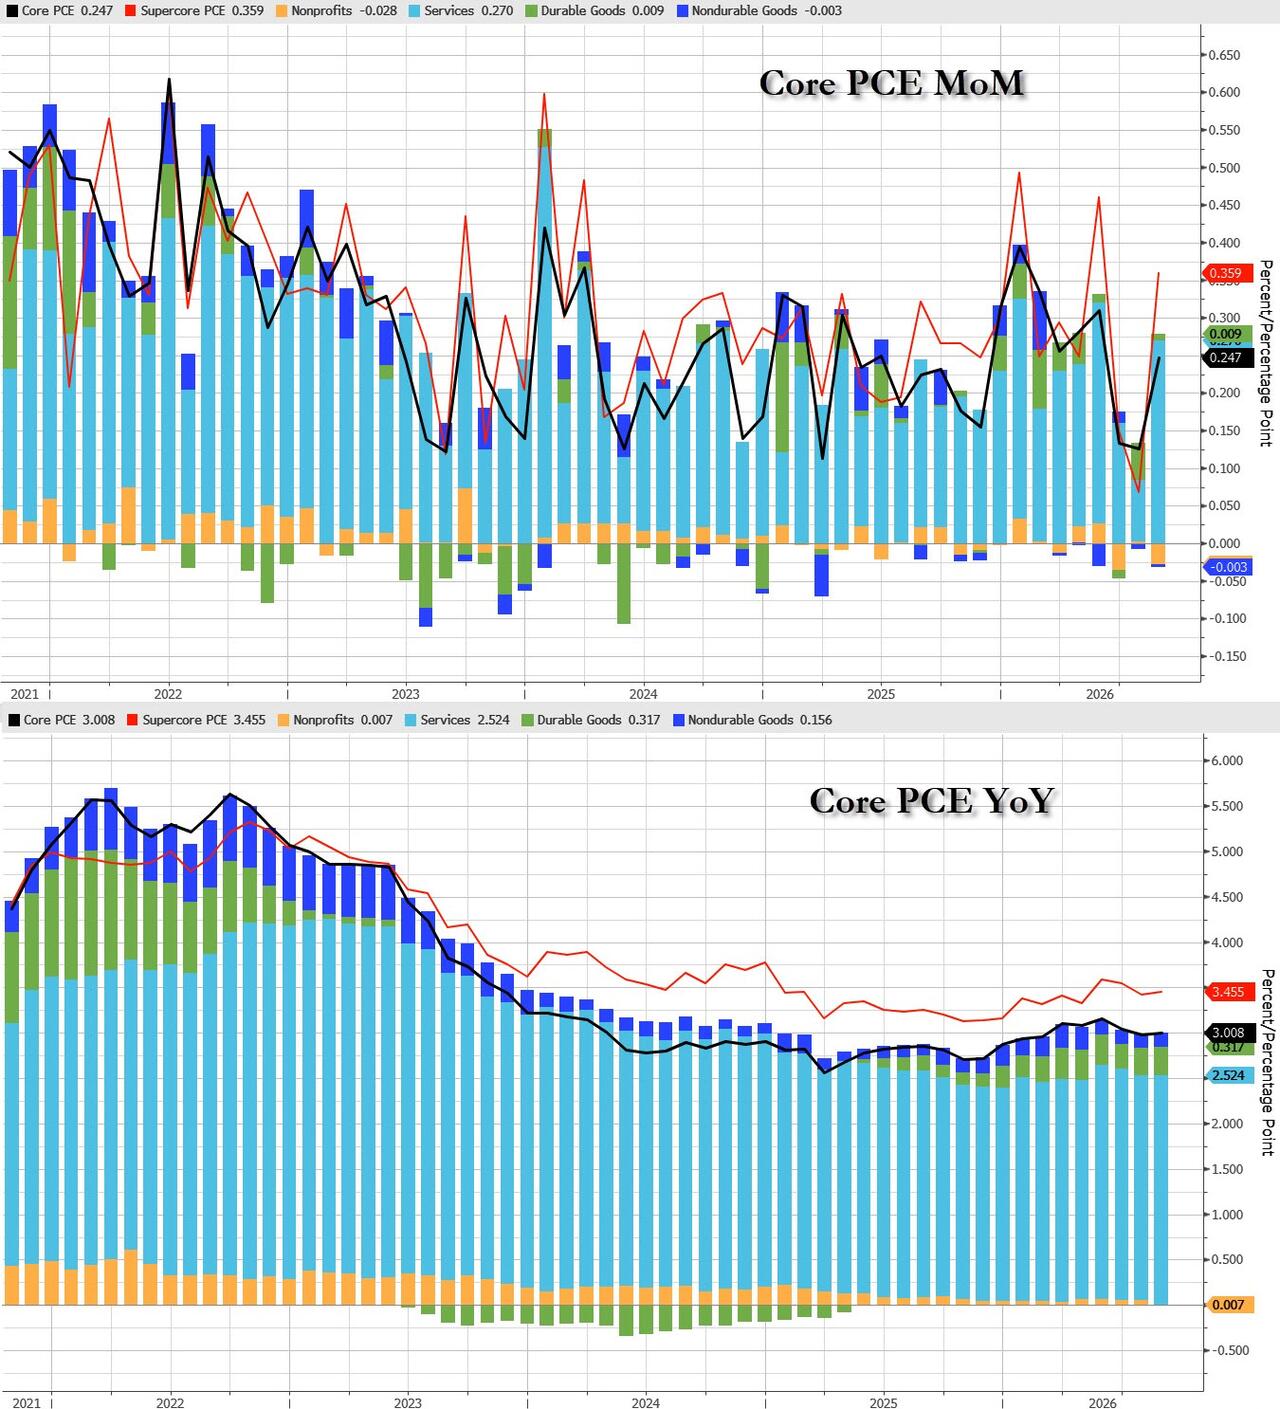
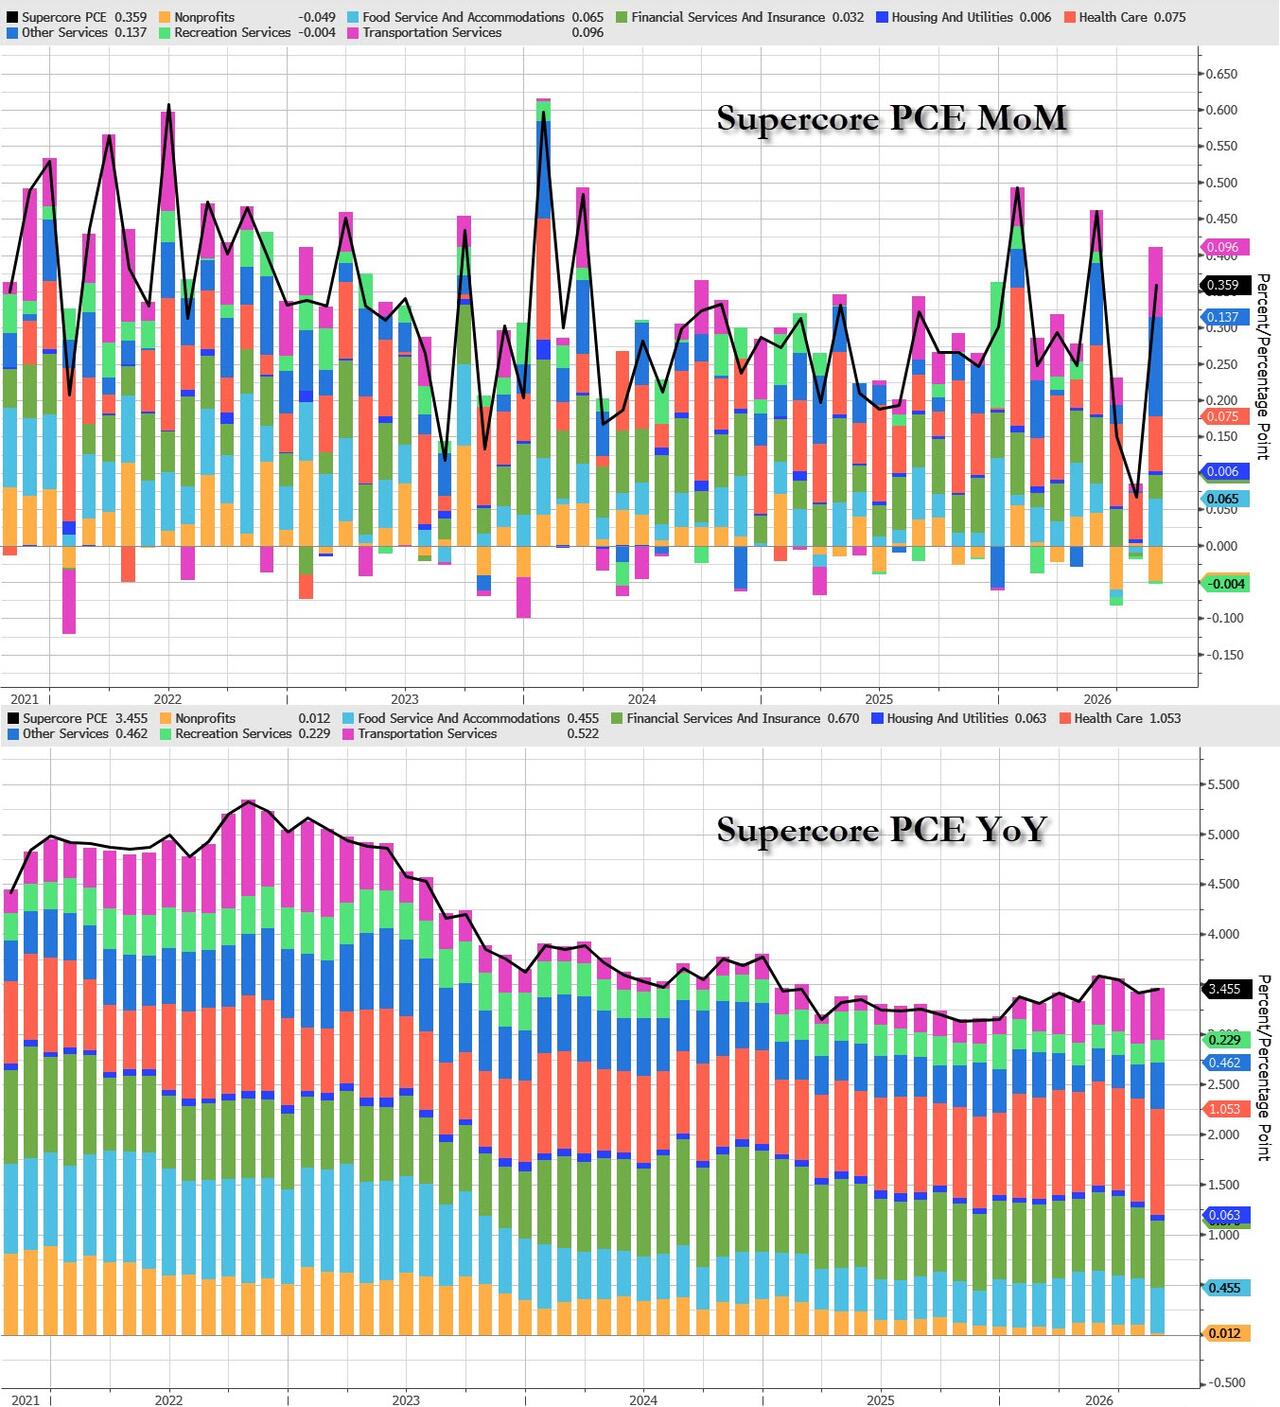
Perhaps more ominously, the much-watched SuperCore PCE (Services ex-shelter) saw price inflation reverse the recent drop on a YoY basis, while surging on a MoM basis.
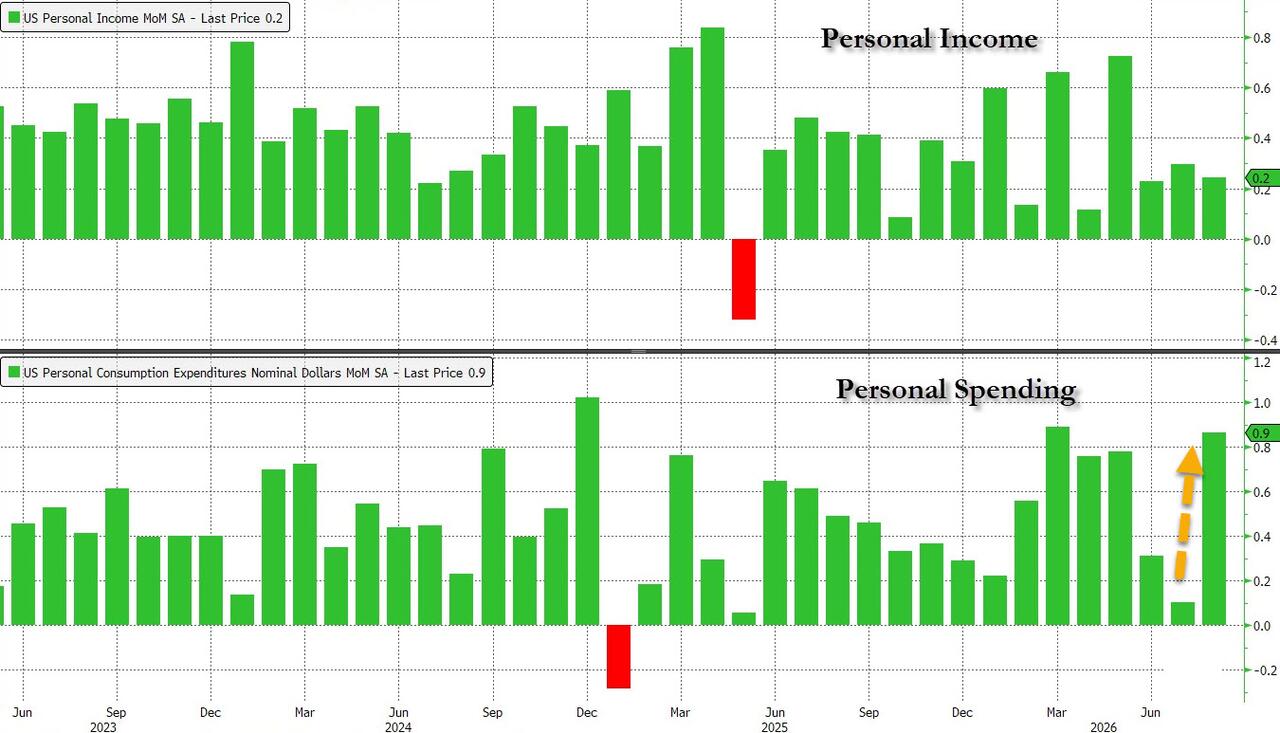
Higher prices were met with much higher spending (+0.9% MoM notional, in line with estimates and up from 0.1% in July) while income growth was dangerously lower, failing to keep up with spending, and rising just +0.2% MoM, which was down from 0.3% in the previous month and missed estimates of 0.5%.
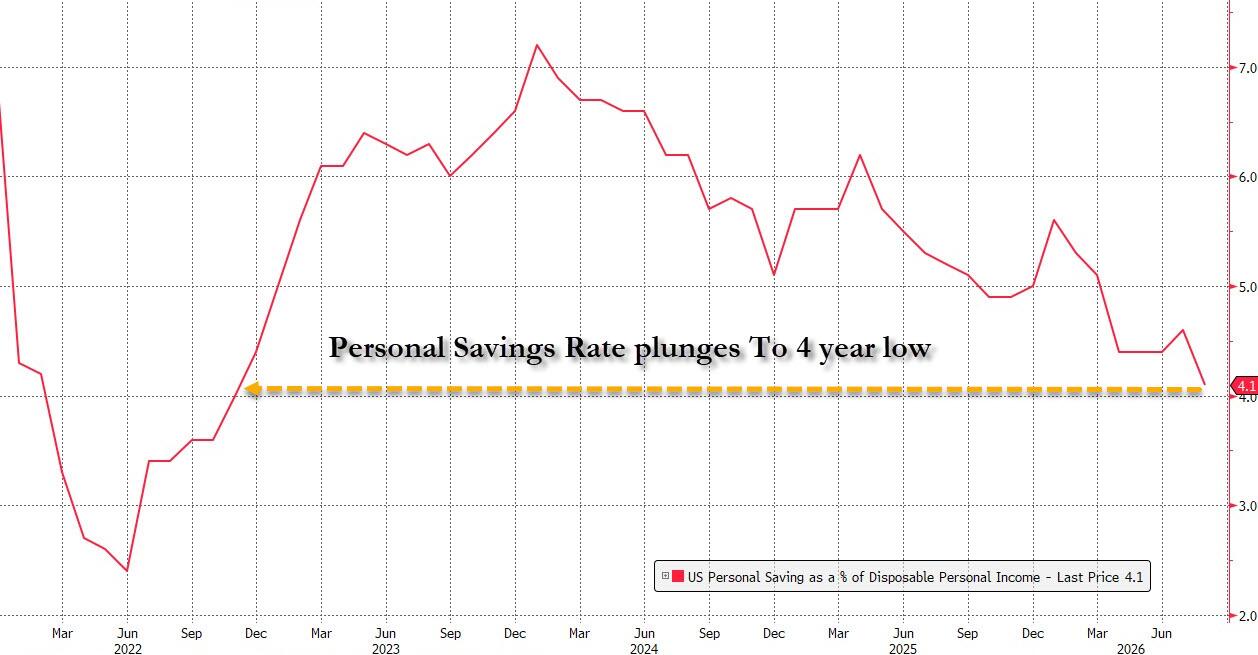
The surprising spike in spending not supported by income, meant that the freshly revised savings rate tumbled again, dropping from 4.6% in July to just 4.1% in August, the lowest since Nov 2022.
While spending growth rose again, Income growth is now the lowest since April 2022!
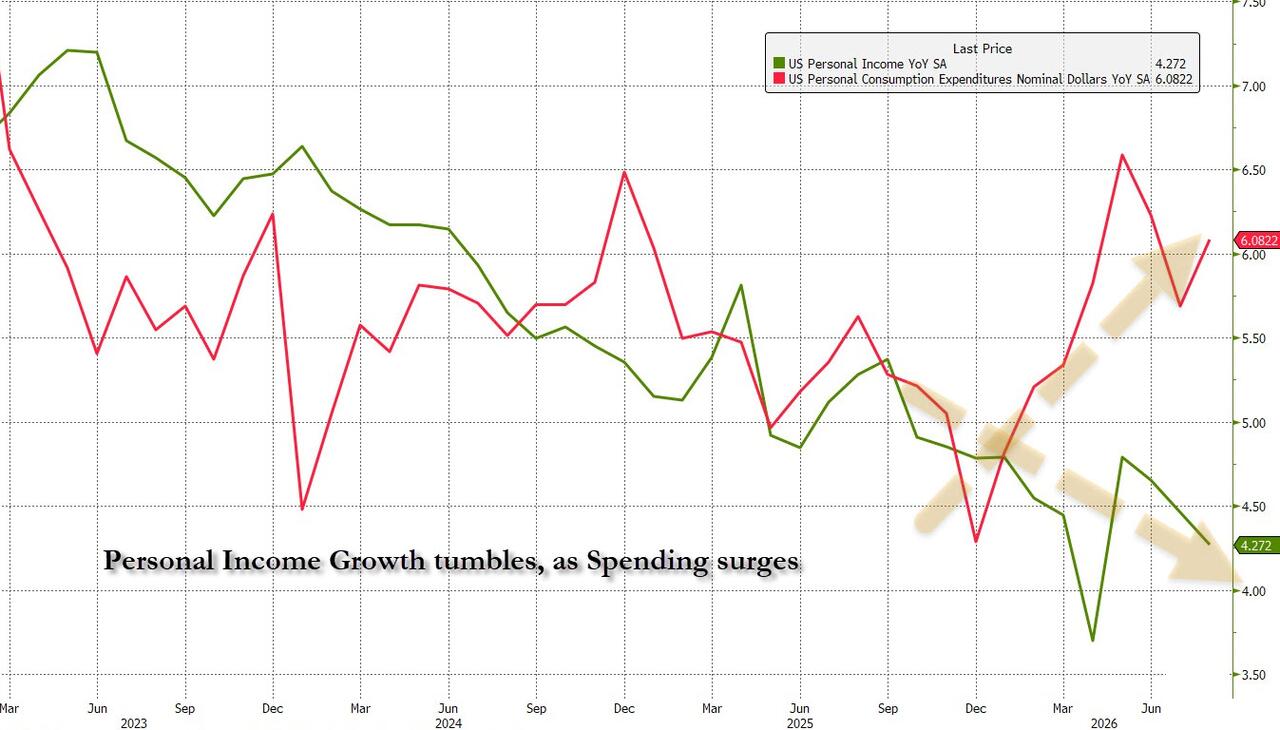
In other words, once again US consumers are failing to keep up with inflation and they can do so only – and temporarily – by digging deep into their savings.
Finally, while the core PCE was indeed lower than expected, recall that as we said above, this is mostly due to a change in methodology. Today, the Bureau of Economic Analysis released its updated PCE deflator methodology, which has been applied retroactively through Q1 2021, with RBC estimating that core PCE’s annual pace is expected to fall 18bps, which would revise July’s reading to 3.1% from 3.3%. They were spot on.
RBC analysts also aid that three changes drive this: portfolio management services will use a CES-based quantity series instead of nominal price deflation; computer software will use a new composite PPI/CPI deflator; and legal services will use a new deflator after the current CPI measure proved unreliable.
In other words, today’s welcome “miss” in core PCE is likely not due to lower prices but due to spreadsheet changes and rebenchmarking.
Tyler Durden
Wed, 09/30/2026 – 09:12