
Dowd: US Disabilities Hit An All-Time High Of 37 Million In July: UP 23% Since Feb 2021
Authored by Ed Dowd via Beyond The Narrative,
The latest Bureau of Labor Statistics data is out, and the number of Americans ages 16 and over reporting a disability has hit a new all-time high of roughly 37 million. As of July 2026, the Current Population Survey series sits at 37,029,000. That’s not a rounding error or a seasonal blip. It’s the continuation of a trend that broke higher more than five years ago and has refused to mean-revert.
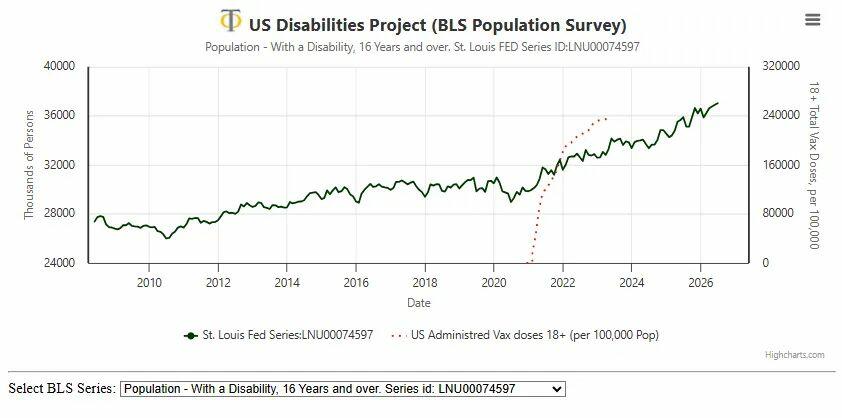
I’ve been tracking this series since early in the COVID era. The charts have been public for years on the Phinance Technologies site and in repeated threads on X. Month after month the total population with a disability grinds higher. From the pre-2020 plateau into early 2021 the numbers were relatively stable. Then something changed.
February 2021 marks the clear inflection. The rate of increase shifted to a new, steeper trajectory, a 3-to-4 sigma departure from the prior trend. In the years since, the survey has added seven million people. Growth of that magnitude in a mature population is not normal aging, not “long COVID” in isolation, and not some gradual sociological shift. It was sudden. It has persisted. And it continues to be treated as background noise by the same public health authorities who spent years obsessed with every other metric.
Let me address the predictable objections, because they surface every time these numbers are posted. First: “It’s just fraud. People are gaming disability benefits.” That claim collapses under basic scrutiny of the data source. This is not Social Security Disability Insurance claims. It is not SSDI awards, which lag, require medical determinations, and are subject to administrative backlogs and incentive effects. This is the Current Population Survey, the same monthly household survey that produces the unemployment rate and labor-force participation numbers. Roughly 60,000 households are contacted each month. Six simple questions are asked about serious difficulty hearing, seeing, concentrating/remembering/making decisions, walking or climbing stairs, dressing or bathing, and doing errands alone. Any “yes” classifies the person as having a disability for statistical purposes.
I laid this out in detail years ago in threads that are still easy to find. The series is real-time, not claims-driven, and has nothing to do with benefit eligibility. The questions have been consistent since 2008. Response patterns do not suddenly invent millions of new disabled respondents because the political winds shifted. When the same survey that markets, banks, and the Federal Reserve rely upon for labor-market signals produces a multi-year, multi-sigma break in disability prevalence, the responsible reaction is investigation, not dismissal.
Second: “It’s illegal aliens flooding the numbers.” This one is equally weak. Undocumented immigrants have long been known to under-respond or avoid government surveys altogether out of fear of detection, deportation risk, or general distrust of authorities. They are not lining up to answer detailed questions about household members’ health limitations over the phone or in person. If anything, the survey systematically undercounts this population relative to reality. The sharp, sustained rise in reported disability began in February 2021, well before the largest recent surges in border encounters, and has continued in a manner inconsistent with simple demographic inflows. The data do not support the claim that the disability spike is an artifact of illegal immigration.
Public health agencies and the media have largely ignored the signal. There has been no serious, transparent inquiry into why the disability rate changed slope so sharply in early 2021 and has remained elevated. Temporary explanations such as COVID itself, lockdowns, mental-health effects of isolation all fail the timing and magnitude tests. The virus was already circulating in 2020 without producing this sustained break. The sharpest acceleration aligned with the mass rollout and subsequent workplace mandates. Correlation is not causation; we are constantly reminded. Fair enough, but when a novel medical intervention is administered to hundreds of millions of working-age adults on an accelerated timeline, and the independent, high-frequency survey of population health then records a multi-sigma regime change precisely then, the burden of proof shifts. Authorities who spent years demanding every other correlation be investigated suddenly lose interest.
The economic implications are not abstract. More than 37 million people reporting disability means a permanently larger share of the population facing barriers to full participation. Labor-force participation among the disabled remains far lower than among those without disability. Employers face higher absence rates and higher costs. Insurance pools absorb elevated claims. The fiscal pressure on entitlement programs grows even if this particular survey is not the claims pipeline. All of it is occurring against a backdrop of demographic aging that was already expected to raise disability prevalence gradually but not at the abrupt rate observed since early 2021.
I have posted the charts for years: total population 16+, the civilian labor force subset, men, women, employed versus not. The pattern is consistent. Rate-of-change moderation appears occasionally, then another leg higher. The February 2021 inflection remains the defining feature. A 3-to-4 sigma shift in trend is not something serious analysts discard. It is the kind of signal that, in any other domain…markets, epidemiology, engineering…would trigger immediate forensic review.
Health authorities have chosen another path. The data continues to accumulate. The total population survey keeps printing higher numbers. The questions asked of households have not changed. The methodology is the same one used for the official employment statistics that move markets every month. Yet the disability series is treated as an inconvenience rather than a red flag.
The conclusion from the data is straightforward. The timing, the magnitude, the concentration among the previously healthy working age population, and the failure of alternative explanations all point to the COVID vaccine campaign as one of the primary driver of the excess disability. That is the assessment I have maintained as the numbers have updated. Ignoring a sustained, multi-sigma break in a core government survey does not make the break disappear. It only guarantees that the consequences continue to compound while institutions look the other way.
The July 2026 print at 37 million is simply the latest confirmation. The trend that began in February 2021 has not been explained by health authorities, has not been investigated with appropriate rigor, and has not been reversed. Until that changes, the data will keep speaking whether anyone in authority cares to listen or not.
“Hear this, you foolish and senseless people, who have eyes but do not see, who have ears but do not hear.” Jeremiah 5:21
Tyler Durden
Thu, 08/13/2026 – 09:50