
Fed’s Favorite Inflation Indicator Ticks Up In July As Americans Suddenly Start Saving More
Following the CPI and PPI internals, this morning’s PCE data should not offer too many surprises with expectations for the headline price Index to rise just 0.1% MoM in July (after deflating for the first time since COVID in June).
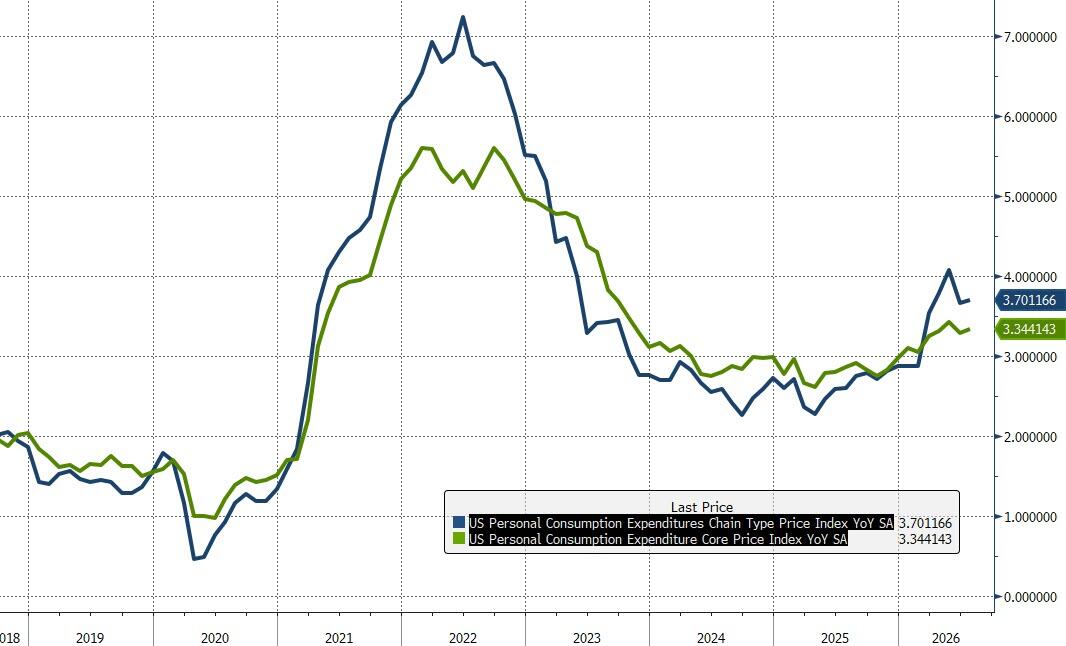
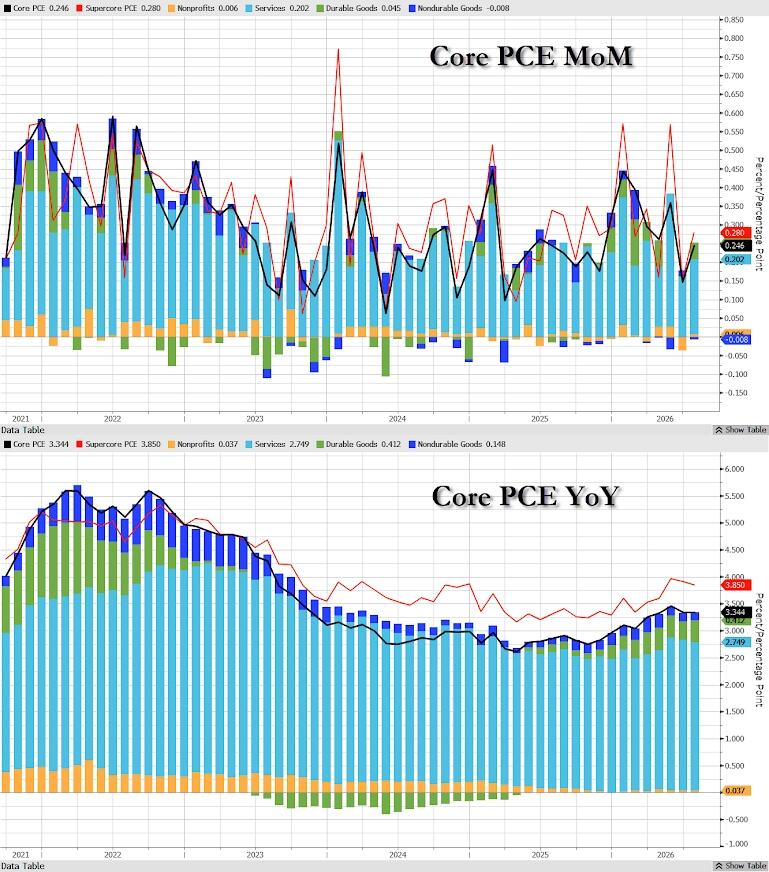
The (old) Fed’s favorite inflation indicator – Core PCE (a measure of price changes in consumer goods and services that excludes volatile food and energy costs) – printed in line with expectations (+0.2% MoM and +3.3% YoY), a very slight uptick…
Services costs continue to dominate the inflationary picture…
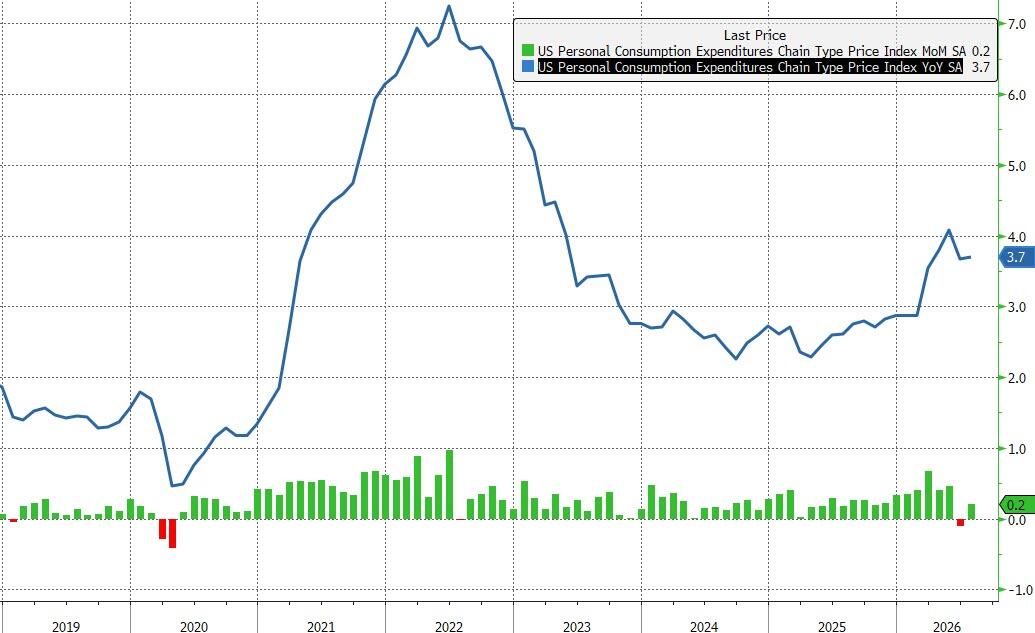
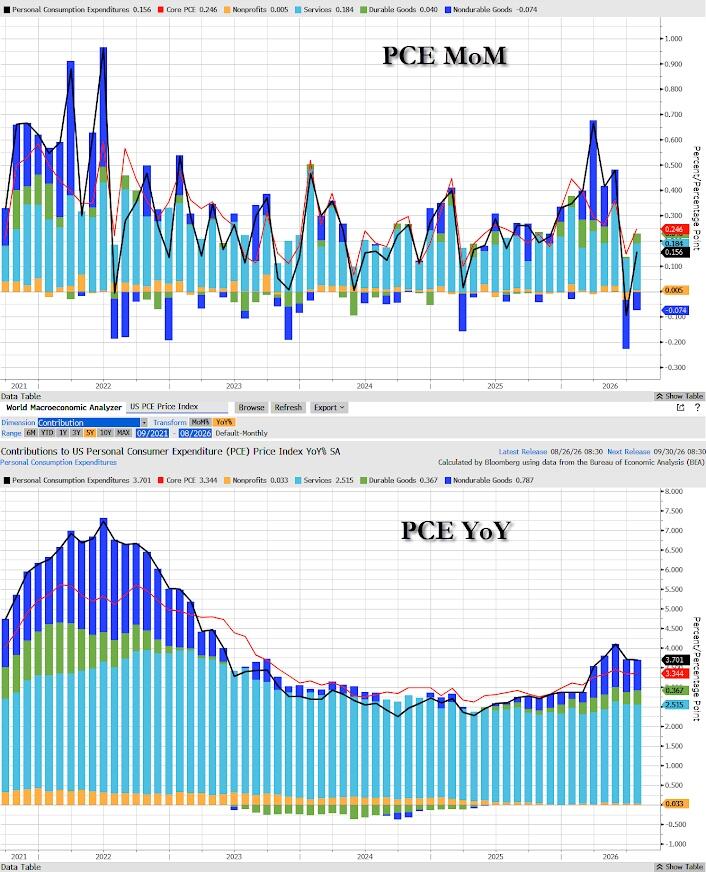
The headline PCE rose 0.2% MoM (hotter than the +0.1% MoM expected) with a small uptick for the YoY at +3.7%…
Non-durable goods prices continued to deflate in July…
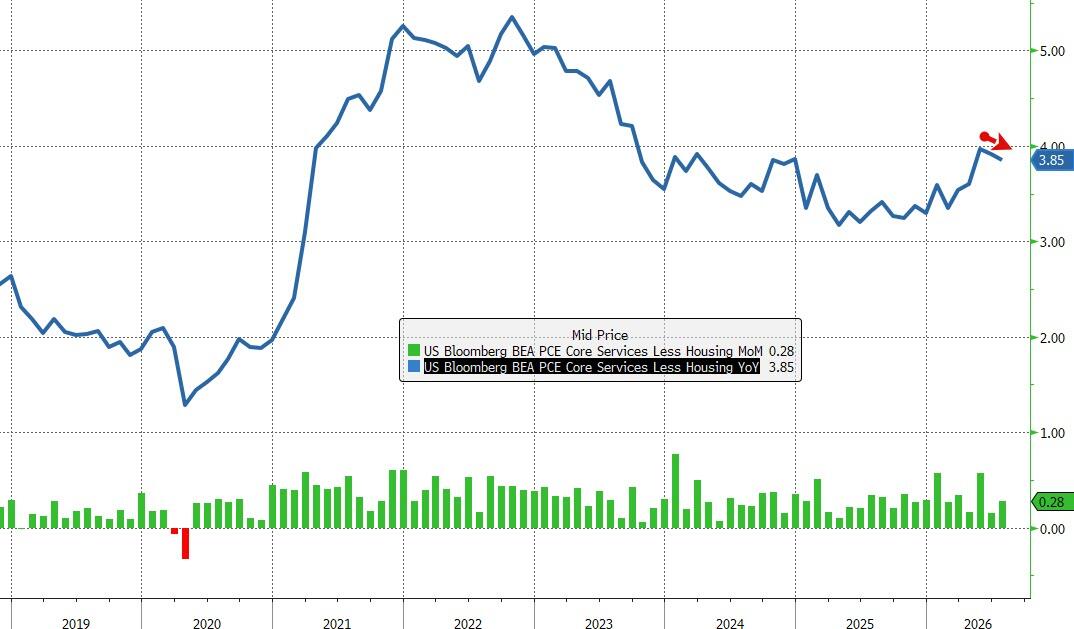
The much-watched SuperCore PCE (Services ex-shelter) saw price inflation slow on a YoY basis…
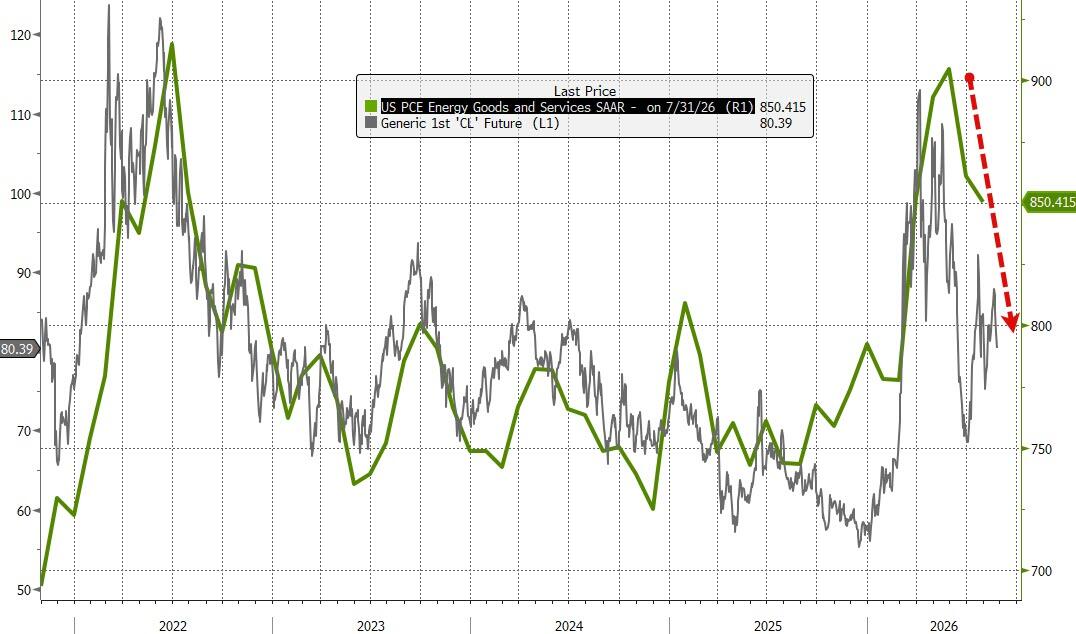
The decline in crude prices dragged the Energy component of PCE lower…
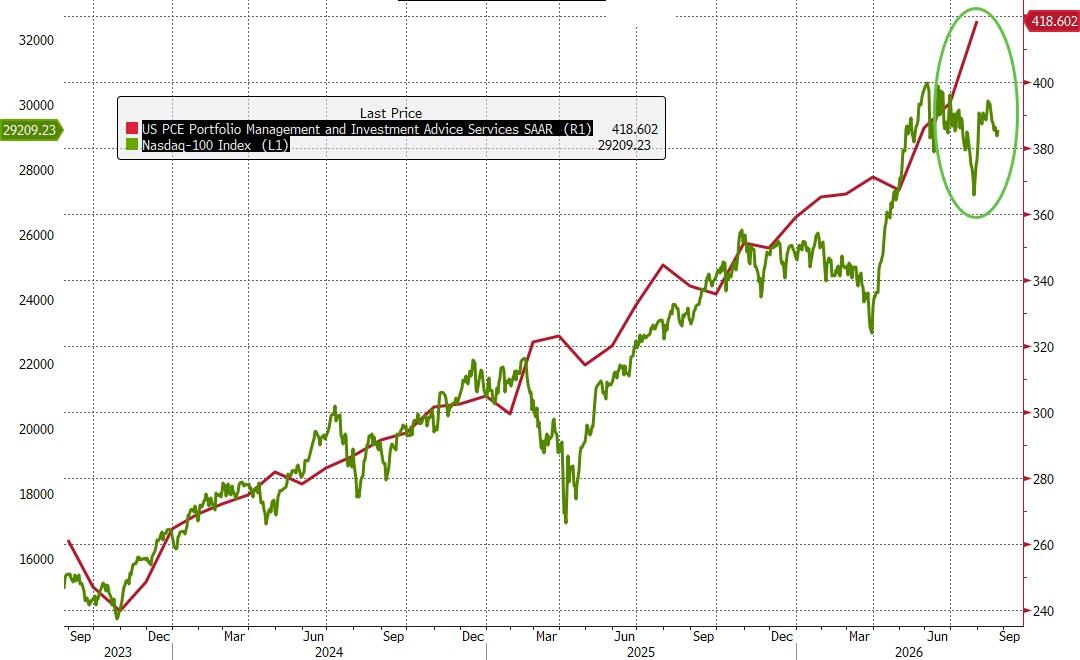
Ironically, while semiconductor prices are major contributors to inflation, it turns out that a rising (or now sideways/falling) stock market is also driving up aggregate prices as portfolio management service costs soar…
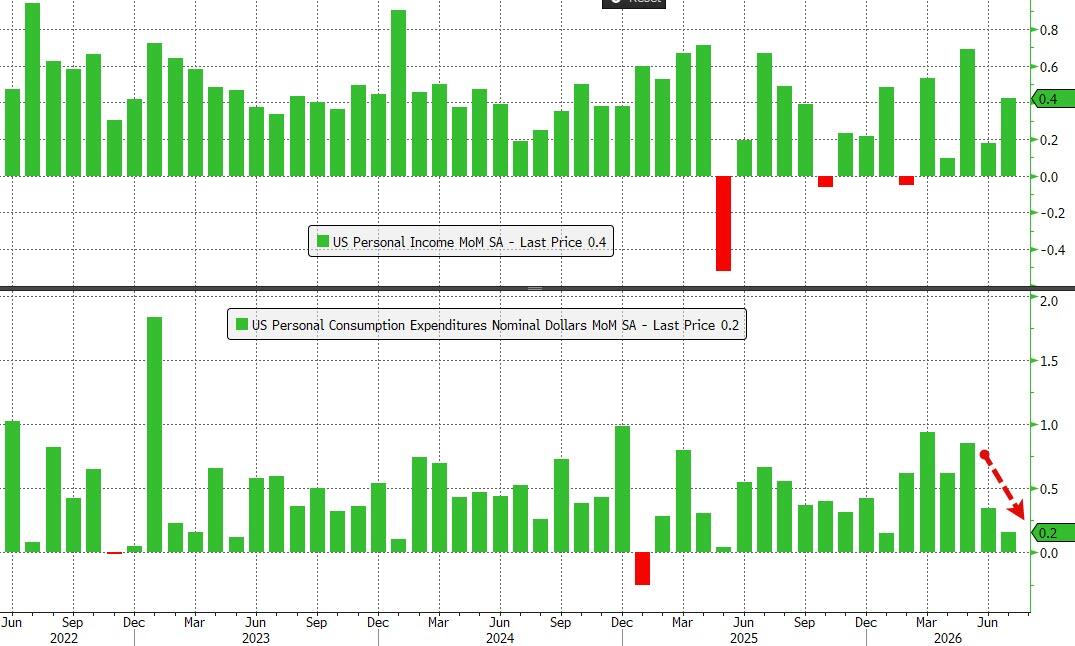
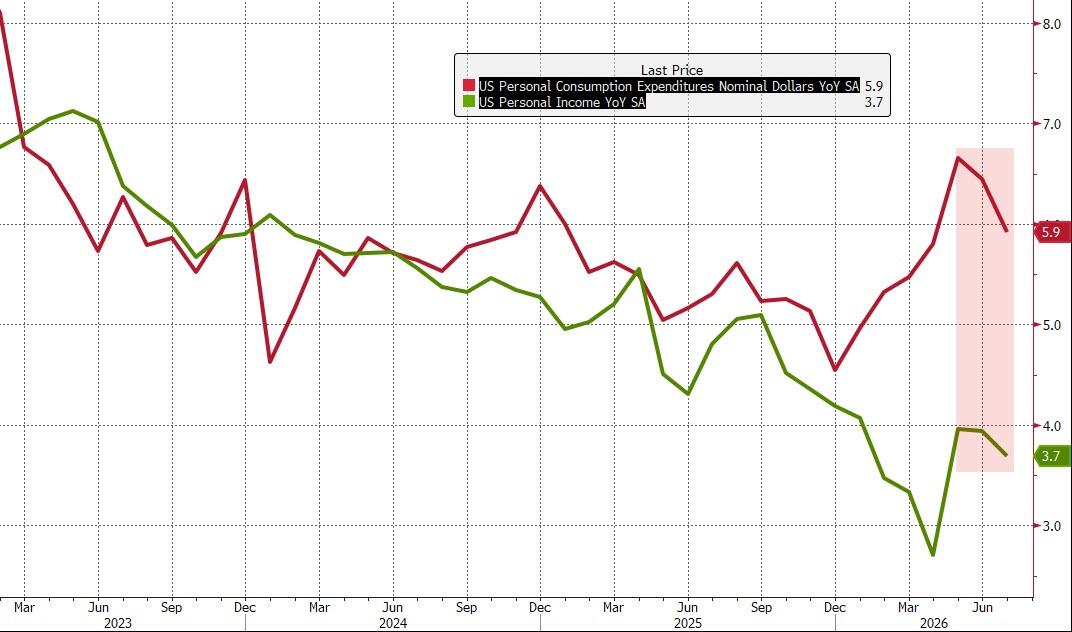
Higher prices were met with higher spending (+0.2% MoM notional) and higher income growth (+0.4% MoM) – both stronger than expected…
Income and spending annual growth is slowing…
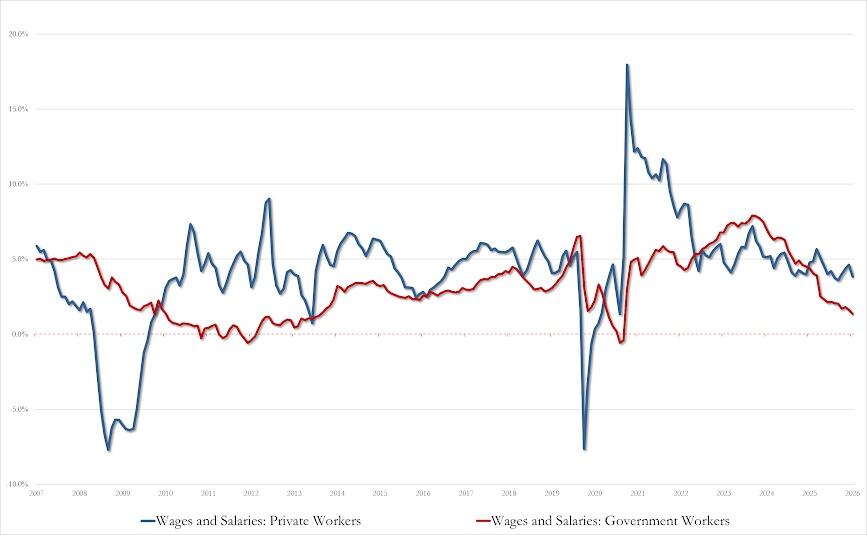
On the income side, both public and private worker wage growth slowed:
-
Govt worker wages drop to just 1.4% YoY, lowest since March 2021
-
Private worker wages drop to 3.8% from 4.6%, lowest since March 2026
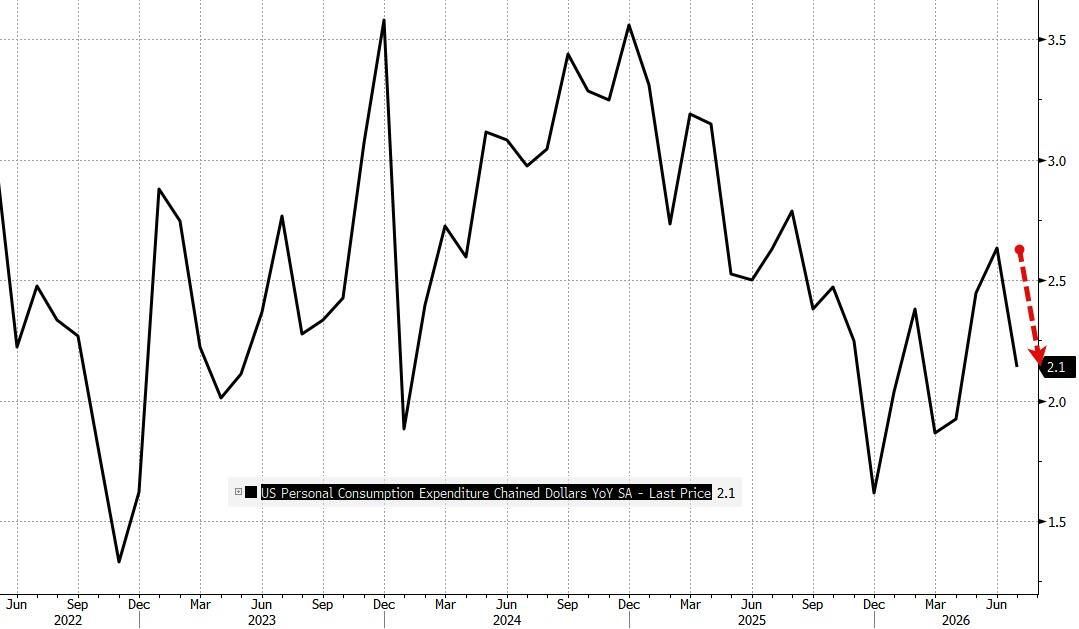
Real personal spending growth dipped notably…
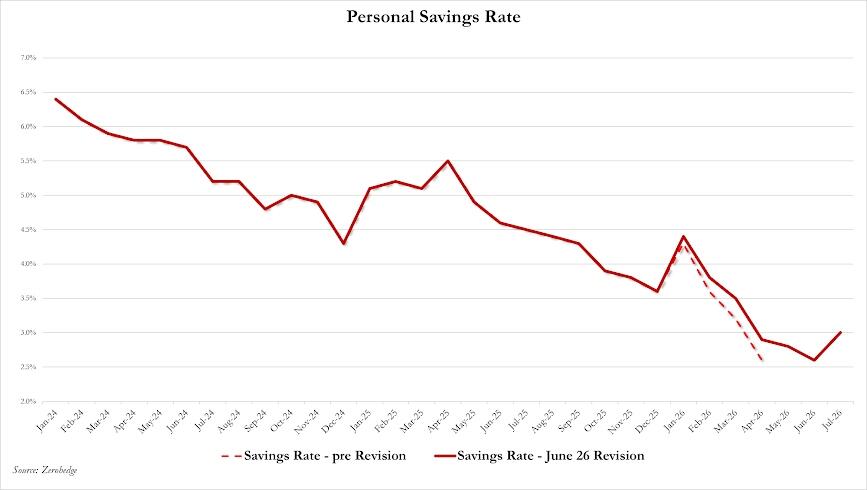
…which might help explain why the savings rate inflected higher from four year lows…
Will today’s disinflationary print (following CPI and PPI) offer Warsh some leeway in his speech on Friday to push back against the endless hawks?
Tyler Durden
Wed, 08/26/2026 – 08:43