The Technical Backdrop: When Flows Meet A Hawkish Fed
Authored by Lance Roberts via RealInvestmentAdvice.com,
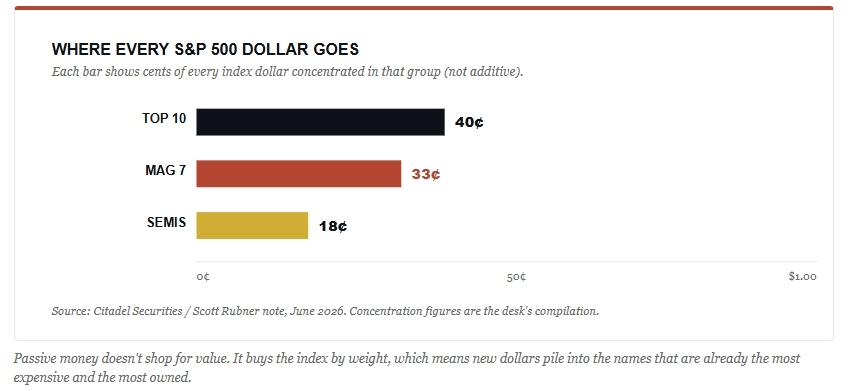
Here’s the setup most investors are underrating right now. Over the next two weeks, the tape will trade on plumbing rather than fundamentals. We just cleared the largest options expiration in history. Quarter-end pension selling comes next, and then July 1 reopens the passive-money firehose into a market that already routes forty cents of every S&P 500 dollar into ten stocks. The whole market technical backdrop points higher into July. But Kevin Warsh’s first meeting as Fed chair just put a rate HIKE back on the table, and that quietly changes the math underneath every one of those flows.
I want to give credit where it’s due. Scott Rubner, the chief equity and derivatives strategist at Citadel Securities, laid out the mechanical case in a note last week, and I agree with most of his map.1 Citadel sees about 35% of all US retail order flow, so when they describe positioning, I listen. The disagreement isn’t about the flows. It’s about what got armed underneath them on Wednesday afternoon.
The Setup: Two Weeks of Pure Mechanics
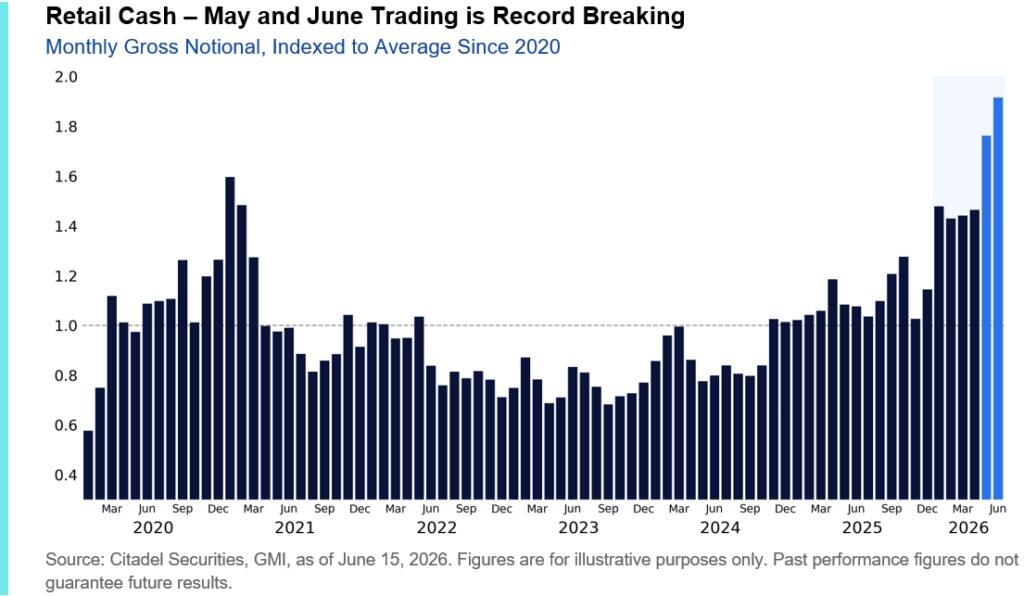
Three events are stacked on top of each other. First, Thursday’s quadruple witching, pulled forward a day because of the Juneteenth holiday, cleared roughly $8.3 trillion of US options exposure, about 28% of all listed open interest, and the biggest expiration ever recorded.1 That event strips a mountain of dealer gamma out of the market, which is the technical way of saying price gets less anchored and more sensitive to whatever flow shows up next. That’s the first piece of the technical backdrop heading into quarter-end.
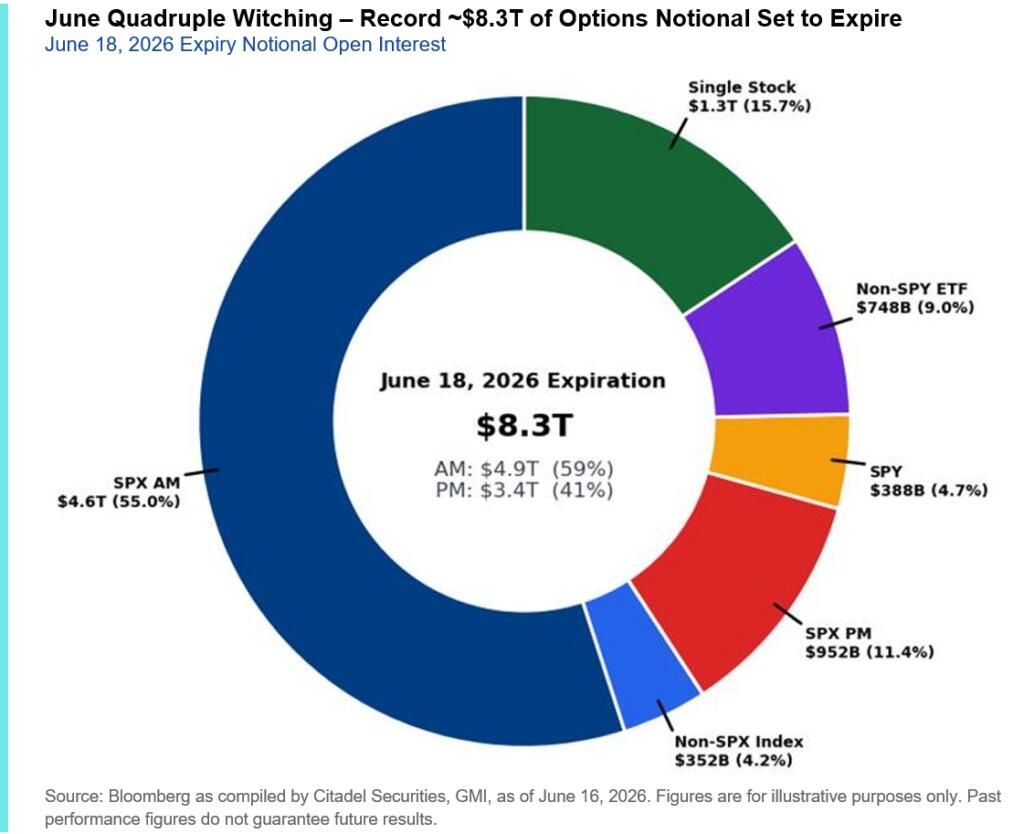
Secondly, we are heading into the end of the second quarter. With the large surge in the financial markets, any allocation-based fund managers are now overweight equities and underweight bonds. As shown, the top 100 US pension funds are now roughly 110% funded, their healthiest position since 2001.1
The reason that is important is that funded plans don’t press their luck; they de-risk. As noted, the “out of balance” mechanic suggests a risk of mechanical selling of equities and buying of bonds into the month-end. Any weakness that the “rebalancing” mechanic creates is a flow story, not a fundamental one. However, on July 1, that negative flow flips the switch the other way. Retirement contributions, target-date funds, passive allocations, and systematic strategies all reload at once.
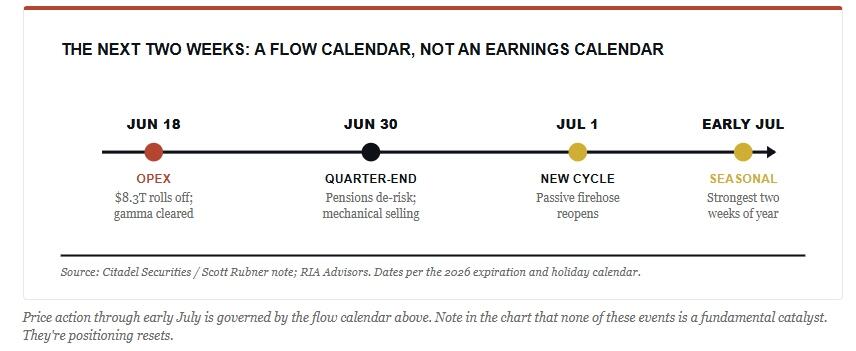
The scale of that reload is the part worth sitting with. ETFs have already pulled in more than $1 trillion this year, running about 45% ahead of last year’s record pace.1 The average full year of ETF inflows through 2024 ran near $490 billion.
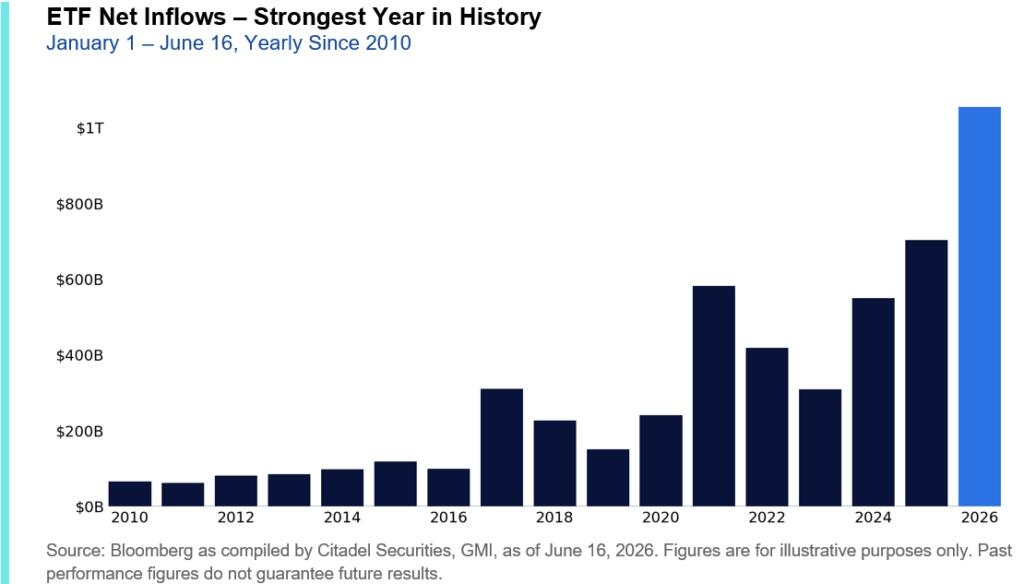
Read that again. Investors have committed twice as much as a normal year’s worth of money in under six months, and a growing slice of it is mechanical.
The Technical Backdrop Beneath the Headlines
Before we argue about flows, let’s anchor the technical backdrop in the actual price. The S&P 500 closed Wednesday at 7,420 after Warsh’s debut knocked 1.21% off the index, then rebounded roughly 1.2% Thursday to near 7,505 ahead of the long weekend.2,3 Even after the Fed scare, the index sits about 2% above its 50-day average, nearly 8% above its 200-day, and only a couple of percent under the all-time high it set this month at 7,620. The spring low of 6,344 is now seventeen percent below us.
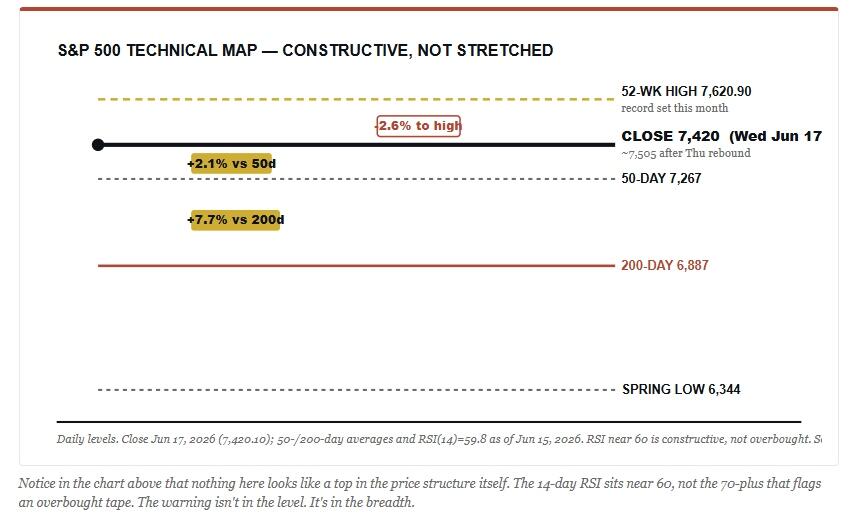
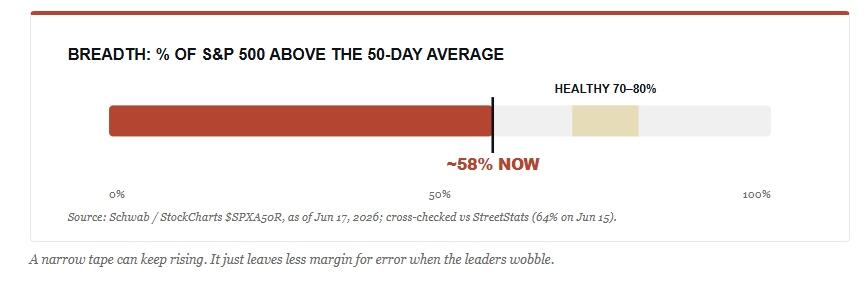
That last point matters. As of Wednesday, only about 58% of S&P 500 members were trading above their own 50-day average.4 Healthy advances usually carry 70% to 80% of the index along for the ride. This one keeps making highs on the backs of a shrinking list of names. The index looks strong. The average stock inside it looks tired.
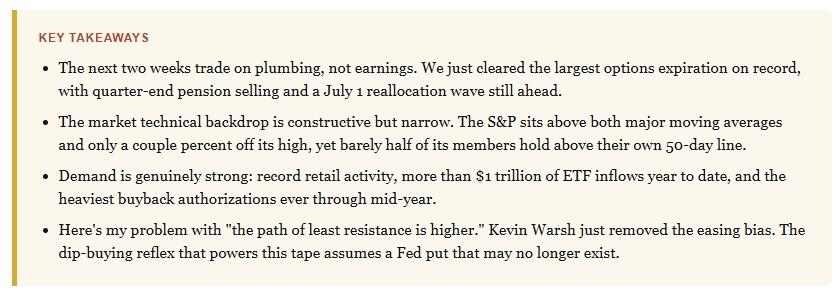
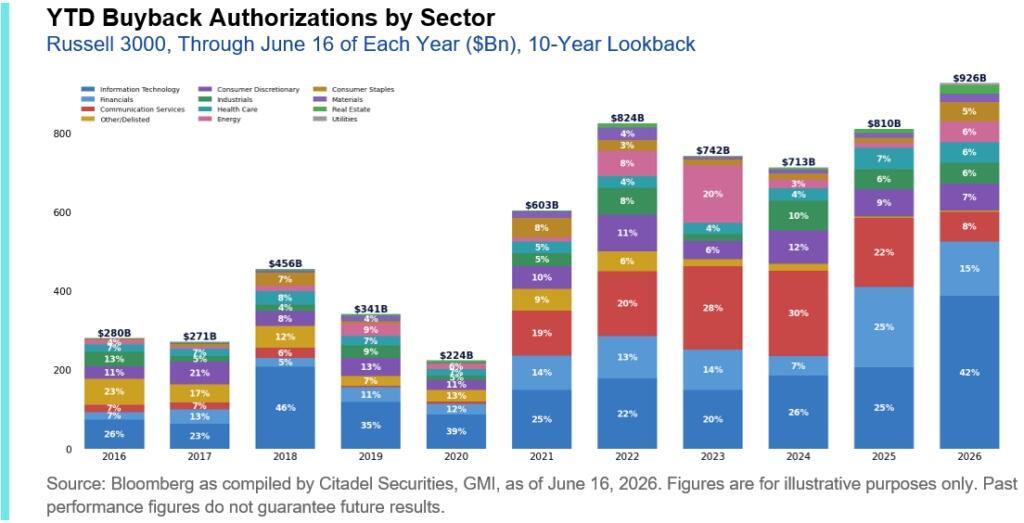
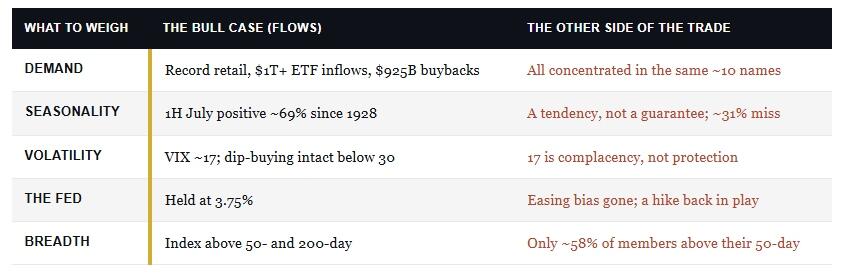
I won’t pretend the demand picture is anything but strong. Retail activity broke records in May and has pushed higher in June, with nine of the ten busiest retail trading days ever landing inside the last month.1 Corporations have authorized north of $925 billion in buybacks this year, the fastest pace on record through mid-year, and technology plus financials make up roughly 57% of it.1 When retail, passive, and the buyback machine all lean in the same direction, fighting that tape has been a losing game.
Here’s the problem buried inside the good news, and it’s the part of the technical backdrop that worries me most. All three of those buyers funnel into the same handful of stocks. Roughly 18 cents of every S&P dollar now chases semiconductors, 33 cents lands in the Magnificent 7, and close to 40 cents flows into the ten largest holdings.1 Leveraged ETFs have compounded it. Their assets hit a record $218 billion, up about 60% since the end of March, with semiconductor-linked leverage nearly tripling.1
Here’s Where I Part Ways With the Flow Note
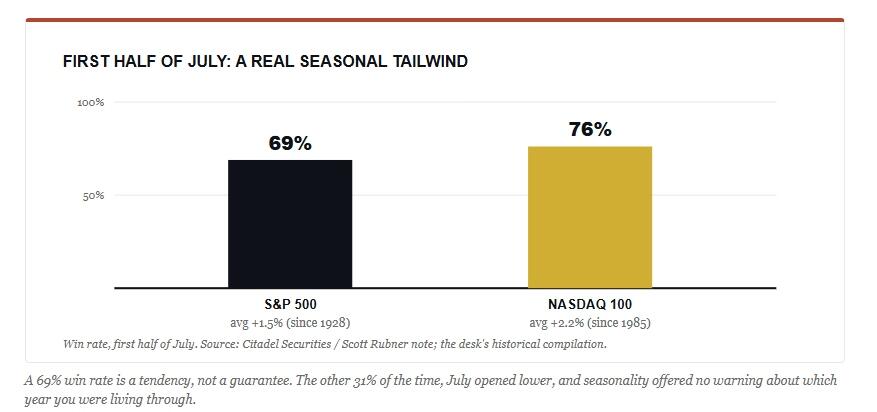
Rubner’s call is that the path of least resistance stays higher into the back half of the year. On the mechanics alone, I’d struggle to argue with him. The seasonal record is genuinely strong, too. Since 1928, the S&P has risen 69% of the time in the first half of July, and the Nasdaq 100 has been positive in 17 of the last 18 years.1
So why am I not all-in on the bull case? Because the note was written one day before, the technical backdrop beneath it changed. The entire dip-buying reflex that Citadel documents rests on an unspoken belief that the Fed has investors’ backs. On Wednesday, Kevin Warsh quietly took that belief away. The committee held at 3.75%, but half the FOMC penciled in at least one rate increase this year, the easing bias vanished from the statement, and the S&P booked its worst first “Fed day” for a new chair since 1994.2,5 The ten-year yield jumped back toward 4.5%.3
Make no mistake about what that does to the math. Citadel’s own data shows the buy-the-dip behavior holds until the VIX climbs above 30. Today it’s nearly 17. That sounds reassuring. It isn’t. A 17 reading isn’t safety, it’s complacency, and complacency is precisely the condition Howard Marks warns about when he says the riskiest moment is the one that feels least risky. As Bob Farrell’s Rule #9 reminds us, when everyone agrees on the outcome, something else tends to happen.
And remember Farrell’s Rule #4: exponential moves go further than anyone expects, but they don’t resolve by going sideways. A market that runs on flows, leverage, and a shrinking group of leaders can absolutely melt up into July. It can also reverse hard the moment those same mechanical buyers turn into sellers. I’ve been writing for weeks that this is a tape driven by positioning more than fundamentals, and I covered the record retail ETF flows in a recent Daily Market Commentary. Strong flows are bullish until the catalyst arrives that makes them stop.
What the Technical Backdrop Means For Your Portfolio
None of this is a reason to sell everything and hide. It’s a reason to participate with discipline rather than abandon. The seasonal and flow tailwinds are real, and fighting them outright has cost investors dearly. We stay invested. But this is a tape to manage, not to chase.
In our portfolio models, we haven’t pressed our most extended winners, but trimmed the most stretched exposure back toward target weight. We also added to our defensive names and let our cash buffer continue to ride for now. As such, we keep participating without betting the account on a melt-up that depends on the Fed staying friendly. That’s the trade-off worth naming out loud. Carrying a little cash caps your upside if the market runs another leg. It also hands you dry powder if quarter-end selling or a Warsh follow-through gives you a better entry. I’ll take that asymmetry here.
Watch three things into the new quarter.
-
The VIX. A move toward 30 is the level where, by Citadel’s own work, the reflexive dip-buyers go quiet.
-
Breadth. If the percentage of stocks above their 50-day keeps fading while the index grinds higher, the divergence usually resolves the wrong way.
-
Lastly, watch the long end of the curve. If Warsh’s signal keeps the ten-year climbing, the most expensive, most crowded, most rate-sensitive corner of this market, the same one soaking up forty cents of every dollar, is the corner that pays for it first.
The technical backdrop and the flows point higher into July. I won’t fight that into the new allocation cycle, but a tripwire just got armed underneath the whole thing. As such, the smart move is to keep one hand on the risk dial while you collect the seasonal tailwind.
Tyler Durden
Mon, 06/22/2026 – 14:45